Note: This publication is currently undergoing major revisions. The current publication will be replaced with a new publication based on stakeholder requirements and scientific advances. We expect to begin sharing details on this soon. If you have input on content, format, or publication frequency at any time, please contact us at cbrfc.webmasters@noaa.gov.Great Basin Water Supply Outlook, January 1, 2010Great Basin Water Supply Outlook, January 1, 2010
Contents
Great Basin Summary
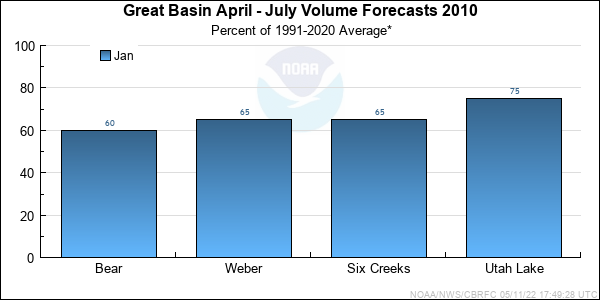
*Median of forecasts within each basin.
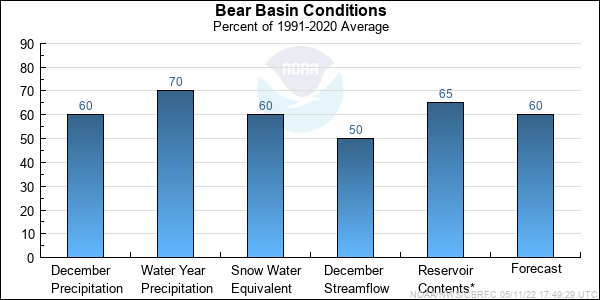
Bear Basin Conditions
The following conditions influenced this month's forecasts:
Precipitation:
Seasonal October through December
precipitation was near 70 percent of average in the upper Bear Basin as a whole.
December precipitation was near 60 percent of average.
Streamflow:
Almost all gages in the Bear were ice affected during January. The Logan at above State Dam however remained ice free and
recorded 90 percent of average.
Snowpack:
January 1st snow water equivalent was 58 percent of average for the Bear Basin as a whole.
Upper Bear River Basin
Snow Plot.
Bear River Basin
Snow Plot.
Soil Moisture:
Modeled Soil
Moisture, click on map to zoom.
Climate Forecasts:
Climate forecasts were not a factored into the northern Utah forecasts because there is not a strong correlation between
El Nino conditions and winter precipitation here.
Forecast Summary:
Due to below average seasonal precipitation and below average January 1st snow water equivalent values
the April through July streamflow volume forecast are below average at this time.
These
forecast now
range between 60 and 80 percent of average with a median value of 60 percent of average.
* Percent usable capacity, not percent average contents.
Click for multi-month Graph.
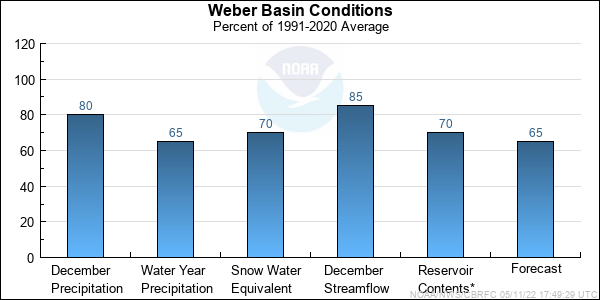
Weber Basin Conditions
The following conditions influenced this month's forecasts:
Precipitation:
Seasonal October through December
precipitation was near 65 percent of average in the Weber Basin.
December precipitation was 78 percent of average.
Streamflow:
December steamflow was near 85 percent of average.
Snowpack:
January 1, snow water equivalent was near 70 percent of average in the basin as a whole.
Weber River Basin
Snow Plot.
Upper Weber River Basin
Snow Plot.
Soil Moisture:
Modeled Soil
Moisture, click on map to zoom.
Climate Forecasts:
Climate forecasts were not a factored into the northern Utah forecasts because there is not a strong correlation between
El Nino conditions and winter precipitation here.
Forecast Summary:
Due to below average seasonal precipitation and below average January st snow water equivalent values
the April through July streamflow volume forecast are below average at this time.
These
forecast now
range between 55 and 75 percent of average with a median value of 65 percent of average.
* Percent usable capacity, not percent average contents.
Click for multi-month Graph.
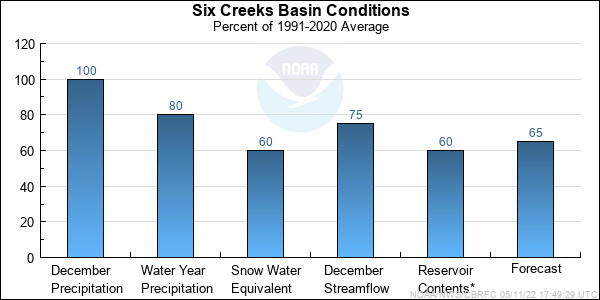
Six Creeks Basin Conditions
The following conditions influenced this month's forecasts:
Precipitation:
Seasonal October through December
precipitation was
near 80 percent of average. December precipitation was near 100 percent of average.
Streamflow:
Little Cottonwood Creek streamflow was 76 percent of average during December.
Snowpack:
January 1st snow water equivalent was near 60 percent of average in the basin as a whole.
Six Creeks River Basin
Snow Plot.
Soil Moisture:
Modeled Soil
Moisture, click on map to zoom.
Climate Forecasts:
Climate forecasts were not a factored into the northern Utah forecasts because there is not a strong correlation between
El Nino conditions and winter precipitation here.
Forecast Summary:
Due to below average January 1st snow water equivalent values the April through July streamflow volume forecasts are below average at this
time. These
forecast now
range between 55 and 80 percent of average with a median value of 65 percent of average.
* Percent usable capacity, not percent average contents.
Click for multi-month Graph.
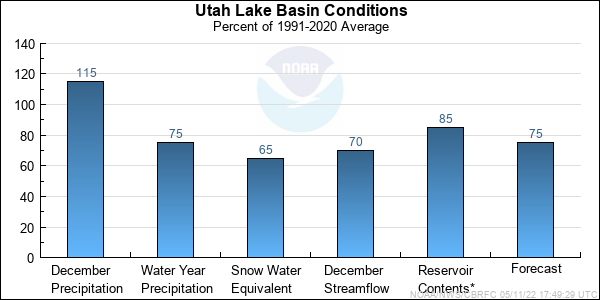
Utah Lake Basin Conditions
The following conditions influenced this month's forecasts:
Precipitation:
Seasonal October thought December
precipitation was 75 percent of average.
December precipitation was near 115 percent of average.
Streamflow:
December streamflow was 70 percent of average.
Snowpack:
January 1st snow water equivalent was near 65 percent of average in the basin as a whole.
Provo River, Utah Lake Basin
Snow Plot.
Soil Moisture:
Modeled Soil
Moisture, click on map to zoom.
Climate Forecasts:
Climate forecasts were not a factored into the northern Utah forecasts because there is not a strong correlation between
El Nino conditions and winter precipitation here.
Forecast Summary:
Due to below average January 1st snow water equivalent values the April through July streamflow volume forecast are below average at
this time. These
forecast
now range between 45 and 75 percent of average with a median value of 70 percent of average.
* Percent usable capacity, not percent average contents.
Click for multi-month Graph.
Differences between the full period forecasts and the residual forecasts may not exactly equal the actual observed volumes due to rounding conventions (see Definitions section).
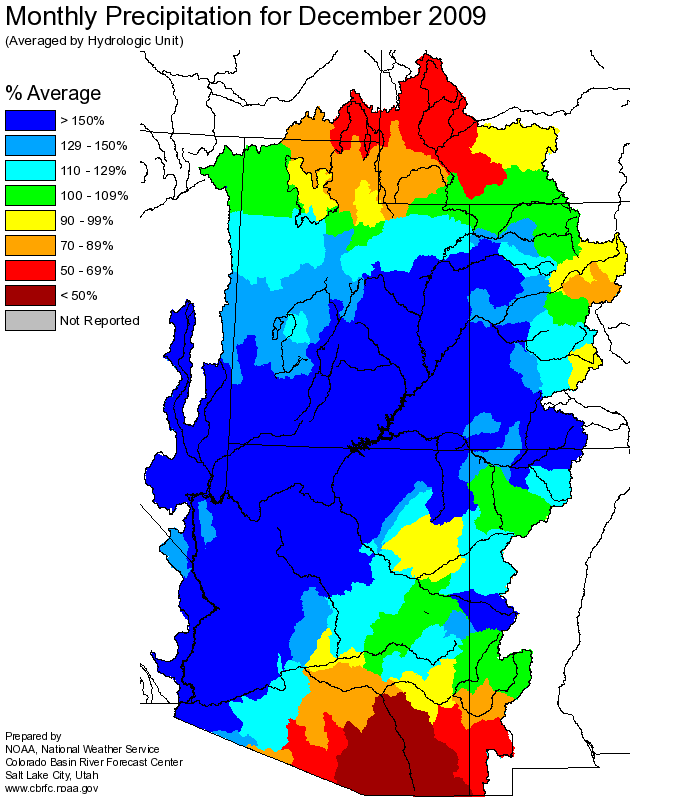
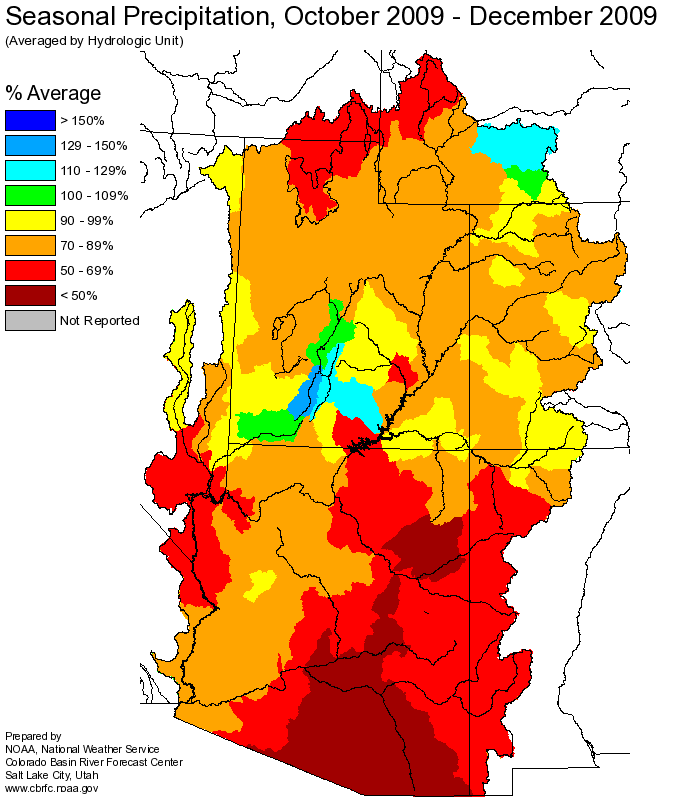
Precipitation Maps
Hydrologist: B.Bernard
