Note: This publication is currently undergoing major revisions. The current publication will be replaced with a new publication based on stakeholder requirements and scientific advances. We expect to begin sharing details on this soon. If you have input on content, format, or publication frequency at any time, please contact us at cbrfc.webmasters@noaa.gov.Lower Colorado Water Supply Outlook, February 1, 2010Lower Colorado Water Supply Outlook, February 1, 2010
Contents
Lower Colorado Summary

*Median of forecasts within each basin.
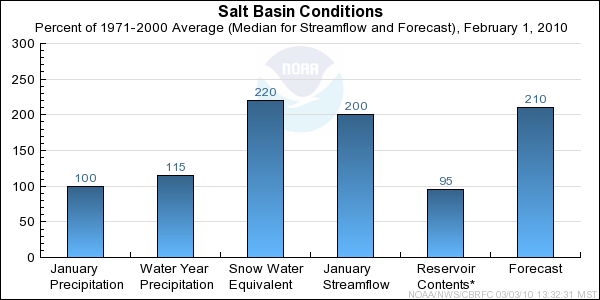
Salt Basin Conditions
The following conditions influenced this month's forecasts:
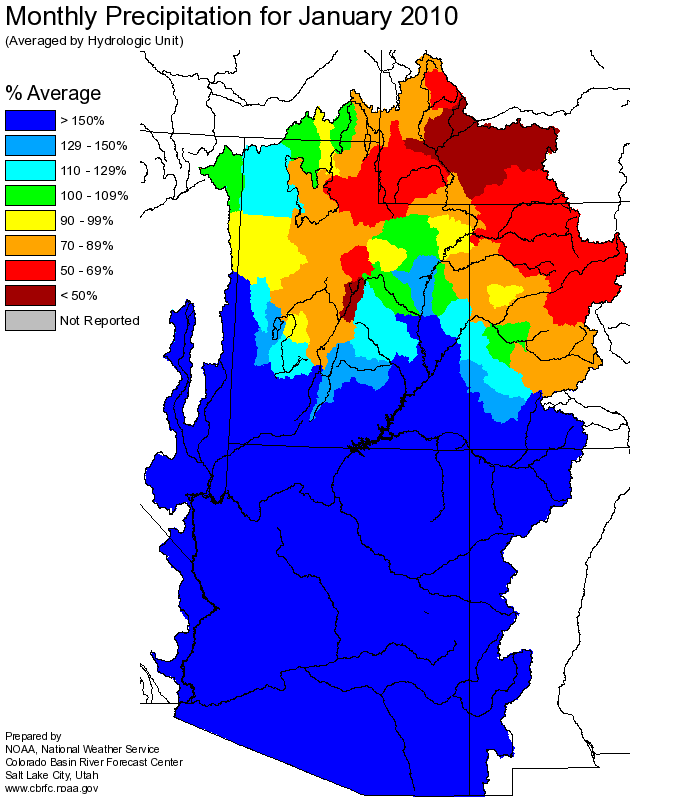
Precipitation:
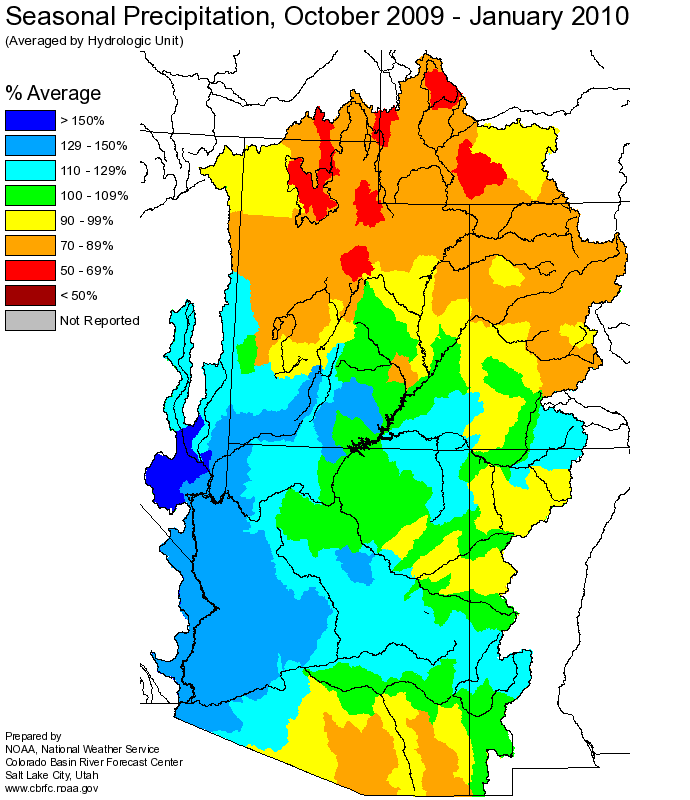
Seasonal October-January
precipitation is near 120 percent of average in the Salt River Basin
and 130 percent in the Verde River Basin.
January
precipitation was significant due to heavy rainfall during the second
half of the month. January precipitation ranged from 200 to 400 percent of average over most of the Salt and Verde
Basins.
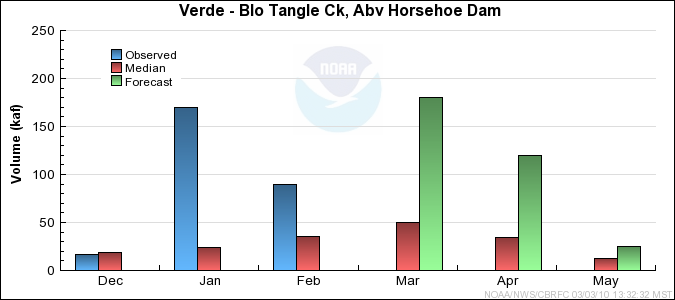
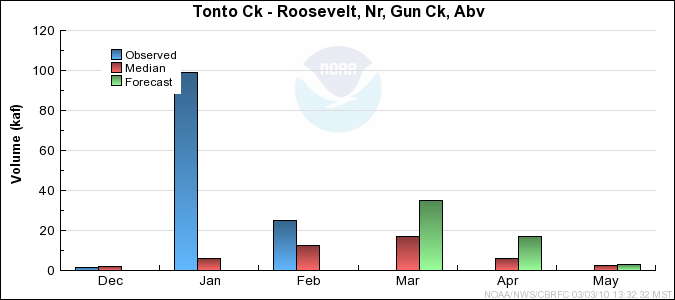
Streamflow:
Significant Runoff occured the third week of January due to heavy rainfall. January streamflow volumes
varied widely and included 850 percent of median on the Salt, 700 percent of median on the Verde Mainstem
and over 1600 percent of median on the Tonto River.
Snow:
Record or near record snowpack conditions for February 1st existed at several higher elevation locations.
Feruary 1st snowpack conditions were near 300 percent of average in the Verde and upper Salt River
Basins.
Salt River Basin
Snow Plot.
Verde River Basin
Snow Plot.
Soil Moisture:
Soils have become saturated in middle to lower elevation areas that received rainfall
during January. At higher elevations where snowpack has persisted throughout the winter
modeled soil moisture states remain slightly drier compared to this time last year.
Climate Forecasts:
El Nino climate conditions suggest increased chances for precipitation in this area.
The El Nino influence was accounted for in generation of these forecasts.
Forecast Summary:
Above average precipitation is anticipated over the next 6-8 weeks due to the El Nino climate conditions.
Additional rainfall combined with wet soils and the much above average snowpack are expected to yield
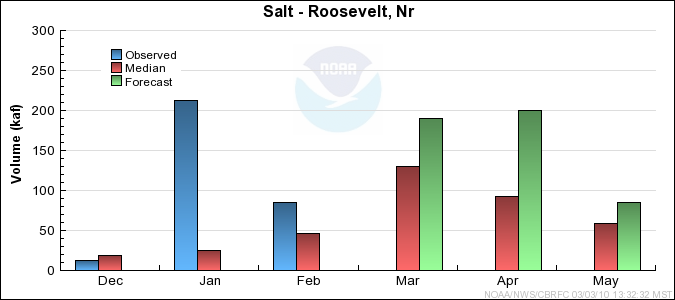
February through May
runoff volumes from 200 to 300 percent of median. Significant rainfall
would result in even larger volumes due to the wet soils.
* Percent usable capacity, not percent average contents.
Click for multi-month Graph.
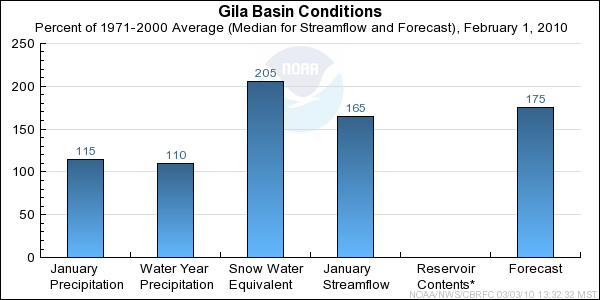
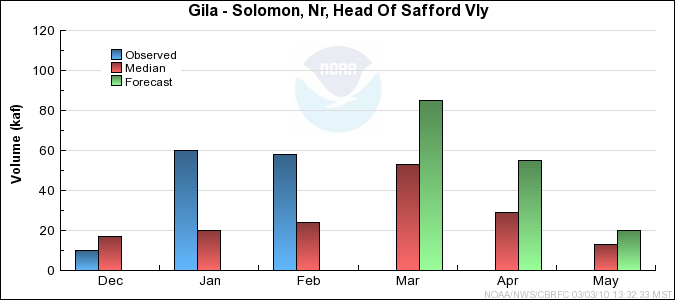
Gila Basin Conditions
The following conditions influenced this month's forecasts:
Precipitation:
Seasonal October-January
precipitation is near average in the upper Gila River Basin.
January
precipitation ranged from 220 to 300 percent of average due to heavy
rainfall during the 3rd week of the month.
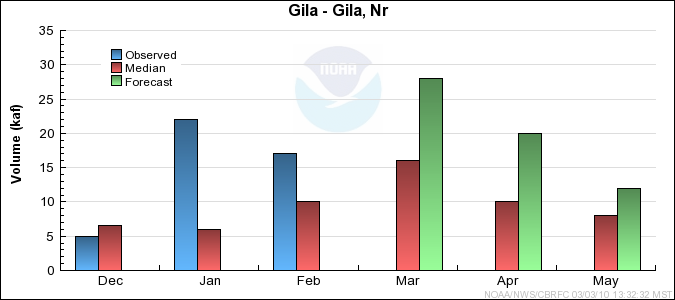
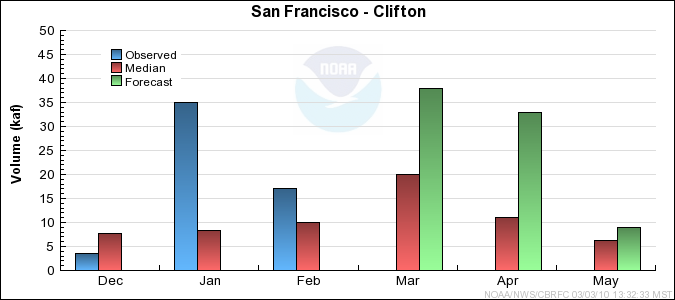
Streamflow:
January runoff volumes were significant, particularly in the San Francisco drainage. Upper Gila runoff
volumes were near 300 to 350 percent of median while those in the San Francisco drainage were near 450
percent of median.
Snow:
Upper Gila Basin snowpack conditions increased to 185 percent of average for February 1st. Basin snowpack
conditions in San Francisco drainage were near 225 percent of average on February 1st.
Upper Gila Basin
Snow Plot.
San Francisco Basin
Snow Plot
Soil Moisture:
Wetter soils now exist in the Gila Basin areas that received rainfall during
January. At higher elevations where snowpack has persisted through the winter, modeled soil
states have changed little from early in the season. Soil moisture states in the
San Francisco drainge were wetter entering the season compared to last year.
Climate Forecasts:
El Nino climate conditions suggest increased chances for precipitation in this area.
The El Nino influence was accounted for in generation of these forecasts.
Forecast Summary:
Above average precipitation is anticipated over the next 6-8 weeks due to the El Nino climate conditions.
Additional rainfall combined with wet soils and the much above average snowpack are expected to yield
February through May
runoff volumes between 150 and 400 percent of median.
* Percent usable capacity, not percent average contents.
Click for multi-month Graph.
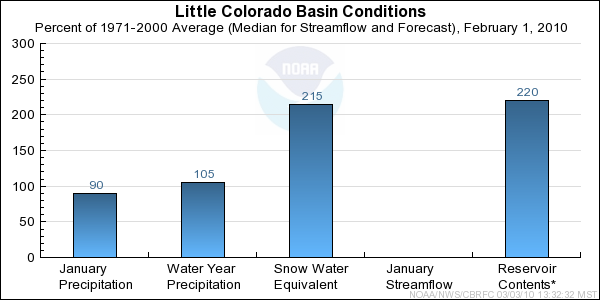
Little Colorado Basin Conditions
The following conditions influenced this month's forecasts:
Precipitation:
Seasonal October-January
precipitation is near 110
percent of average.
Significant
precipitation fell in January with monthly totals ranging from 240 to 380 percent
of average in the Little Colorado River Basin.
Streamflow:
January streamflow volumes in the Little Colorado Basin varied depending on elevation of the
stream gage and proximity to the snowpack. January volumes exceeded 150 percent of median where rainfall
had a greater influence on streamflow.
Snow:
Basin snowpack conditions ranged frome 190 to 300 percent of average on February 1st
in the southern Headwaters of the Little Colorado Basin.
Little Colorado Southern Headwaters
Snow Plot
Central Mogollon Rim
Snow Plot
Soil Moisture:
Modeled soil moisture remains slightly drier than this time last year under areas of
continous snowpack. At lower elevations below the snow line soil moisture states have
become much wetter since mid January.
Climate Forecasts:
El Nino climate conditions suggest increased chances for precipitation in this area.
The El Nino influence was accounted for in generation of these forecasts.
Forecast Summary:
Above average precpitation is anticipated over the next 6-8 weeks due to the El Nino climate conditions.
Additional rainfall combined with the wetter soils and significant snowpack are expected to yield
February through May
runoff volumes from near 200 to 550 percent of median.
* Percent usable capacity, not percent average contents.
Click for multi-month Graph.
Differences between the full period forecasts and the residual forecasts may not exactly equal the actual observed volumes due to rounding conventions (see Definitions section).
Monthly Streamflows
Precipitation Maps
Hydrologist: G. Smith
