New 1981-2010 Averages being used this year.
Note: This publication is currently undergoing major revisions. The current publication will be replaced with a new publication based on stakeholder requirements and scientific advances. We expect to begin sharing details on this soon. If you have input on content, format, or publication frequency at any time, please contact us at cbrfc.webmasters@noaa.gov.Lower Colorado Water Supply Outlook, February 1, 2012Lower Colorado Water Supply Outlook, February 1, 2012
Contents
Lower Colorado Summary

*Median of forecasts within each basin.
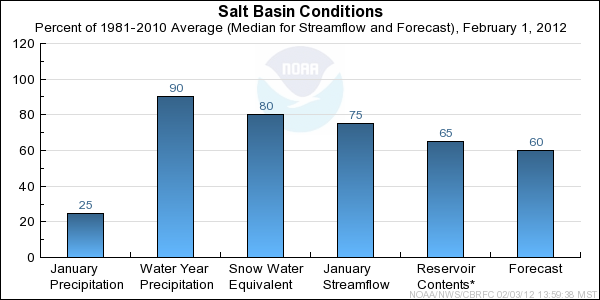
Salt Basin Conditions
The following conditions influenced this month's forecasts:
Precipitation:
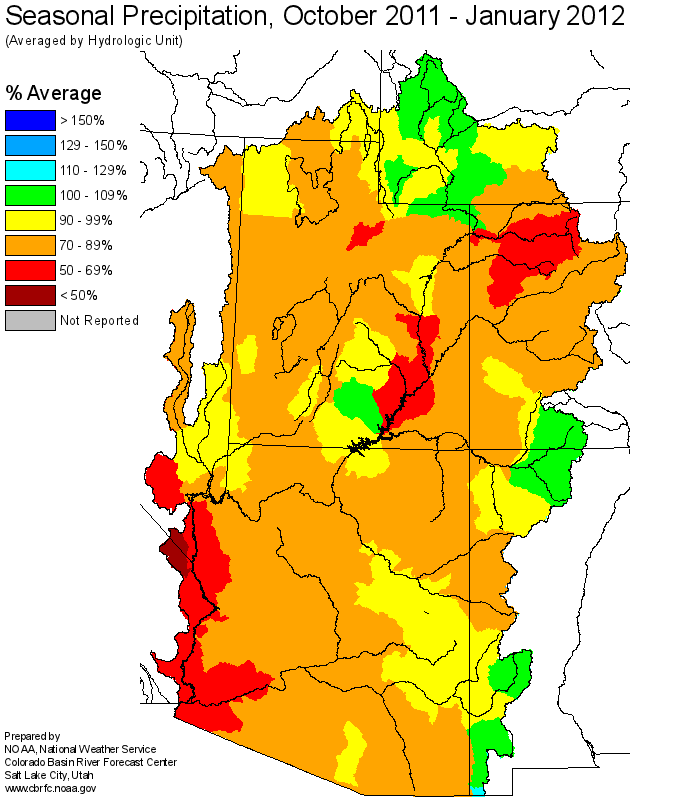
Seasonal October-January
precipitation was
near 90 percent of average in the Salt River Basin and 85 percent of average in the Verde River Basin.
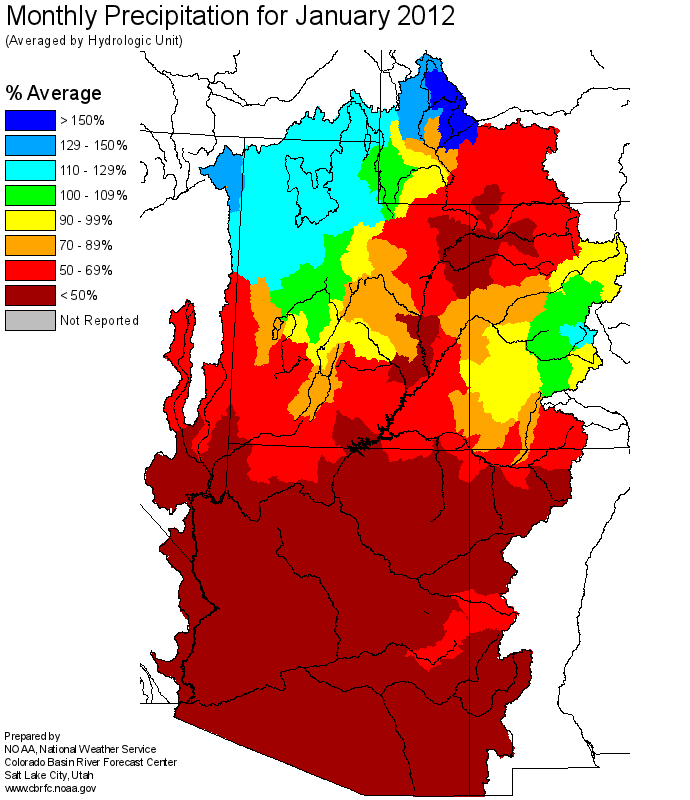
January
precipitation was 15 to 30 percent of average in the Salt and Verde River Basins.
Streamflow:
January streamflow was near 75 percent of median on the Salt and Verde Rivers.
Snow:
February 1st snowpack conditions was 65 percent of average in the Verde River Basin, with condtions in
the upper Salt River Basin near 90 percent of average.
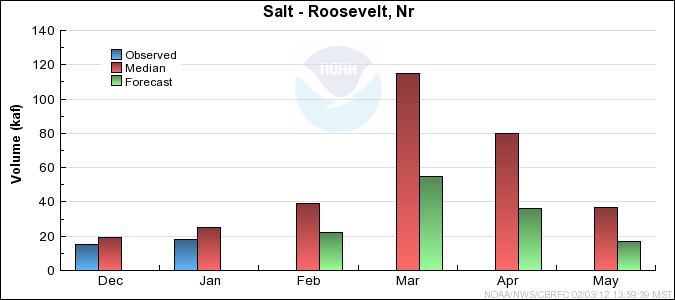
Salt River Basin
Snow Plot.
Verde River Basin
Snow Plot.
Soil Moisture:
Modeled soil moisture states are near to below average at this time.
Climate Forecasts:
La Nina climate conditions suggest decreased chances for precipitation in this area.
The La Nina influence was accounted for in generation of these forecasts.
Forecast Summary:
Dry conditions in January were consistent with La Nina climate conditions that currently exist. Seasonal
precipitation October-January was generally average to below average. La Nina
climate conditions suggest below average precipitation over the next few months.
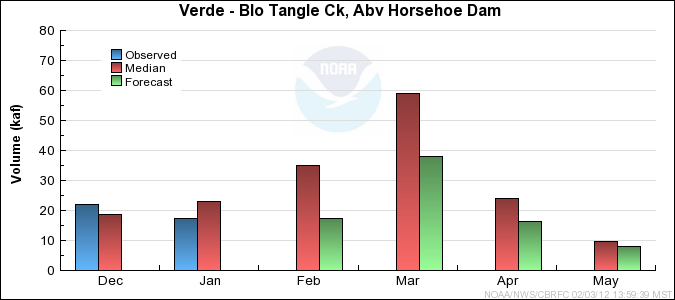
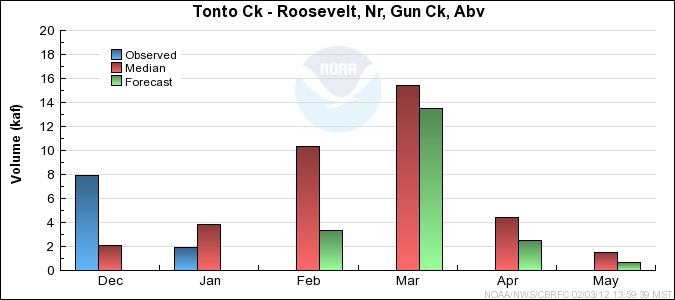
Forecast volumes are near 57 percent of median in the
Tonto, 59 percent of median in the Verde River Basin and 46 percent of median in the Salt River Basin.
* Percent usable capacity, not percent average contents.
Click for multi-month Graph.
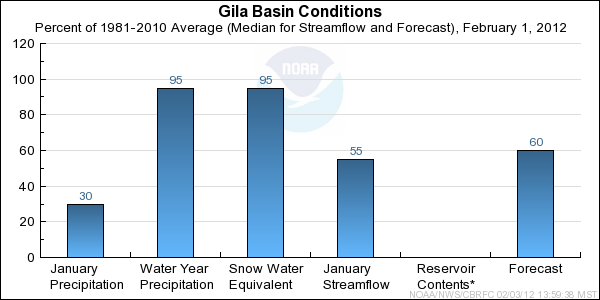
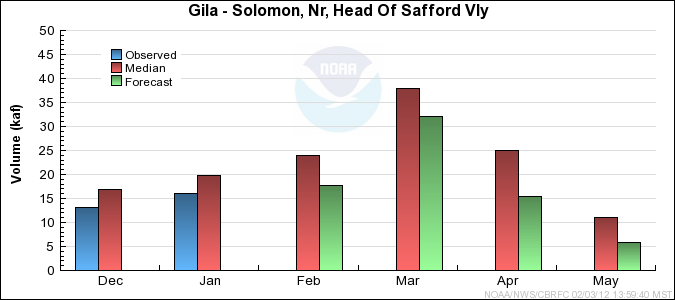
Gila Basin Conditions
The following conditions influenced this month's forecasts:
Precipitation:
Seasonal October-January
precipitation was
95 percent of average.
January
precipitation was 30 percent of average.
Streamflow:
January streamflow was 55 percent of median.
Snow:
February 1st snowpack conditions were near 95 percent of average in the upper Gila Basin.
Upper Gila Basin
Snow Plot.
San Francisco Basin
Snow Plot
Soil Moisture:
Modeled soil moisture states are near average at this time.
Climate Forecasts:
La Nina climate conditions suggest decreased chances for precipitation in this area.
The La Nina influence was accounted for in generation of these forecasts.
Forecast Summary:
Dry conditions in January were consistent with La Nina climate conditions that currently exist. Seasonal
precipitation October-January was generally average. La Nina
climate conditions suggest below average precipitation over the next few months.
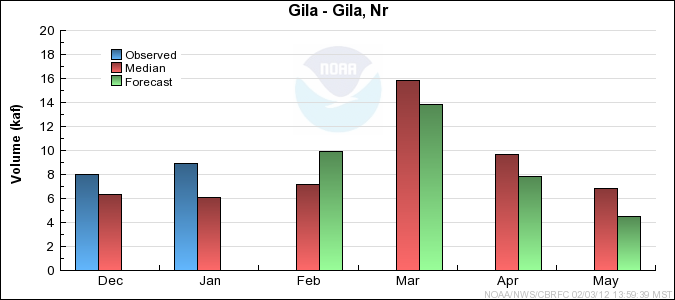
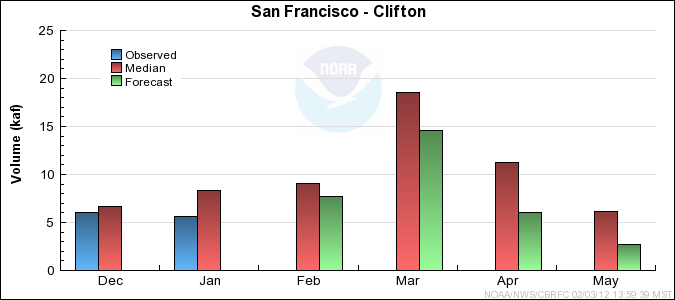
Forecast volumes range from 52 to 72
percent of median.
* Percent usable capacity, not percent average contents.
Click for multi-month Graph.
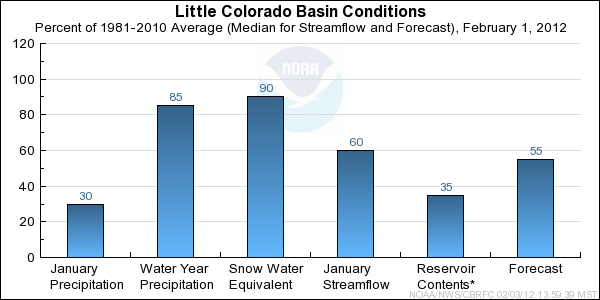
Little Colorado Basin Conditions
The following conditions influenced this month's forecasts:
Precipitation:
Seasonal October-January
precipitation was
85 percent of average.
January
precipitation was 30 percent of average throughout the Little Colorado Basin.
Streamflow:
Minimal streamflow observations exist for January. The January volume on the
Little Colorado near Lyman was near 60 percent of median.
Snow:
Basin snowpack conditions on February 1st were near 90 percent of average in the southern Headwaters.
Little Colorado
Snow Plot
Central Mogollon Rim
Snow Plot
Soil Moisture:
Modeled soil moisture states are near to below average at this time.
Climate Forecasts:
La Nina climate conditions suggest decreased chances for precipitation in this area.
The La Nina influence was accounted for in generation of these forecasts.
Forecast Summary:
The presence of La Nina climate conditions suggest below average precipitation into the
spring. Below average seasonal precipitation exists over most of the Little Colorado Basin.
February-May streamflow volumes are
forecast to range from 43 to 79 percent of median.
* Percent usable capacity, not percent average contents.
Click for multi-month Graph.
Differences between the full period forecasts and the residual forecasts may not exactly equal the actual observed volumes due to rounding conventions (see Definitions section).
Monthly Streamflows
Precipitation Maps
Hydrologist: T.Cox
