New 1981-2010 Averages being used this year.
Note: This publication is currently undergoing major revisions. The current publication will be replaced with a new publication based on stakeholder requirements and scientific advances. We expect to begin sharing details on this soon. If you have input on content, format, or publication frequency at any time, please contact us at cbrfc.webmasters@noaa.gov.Lake Powell Water Supply Outlook, June 1, 2012Lake Powell Water Supply Outlook, June 1, 2012
Contents
Lake Powell Sub-Basin Summaries
*Median of forecasts within each basin.
*Median of forecasts within each basin.
*Median of forecasts within each basin.
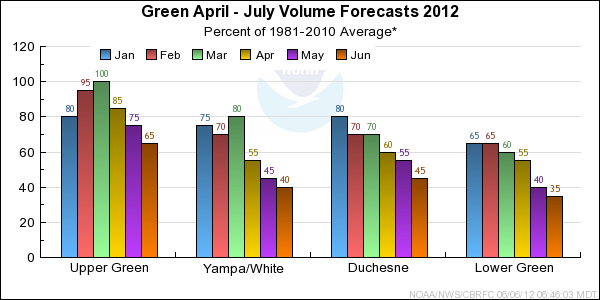
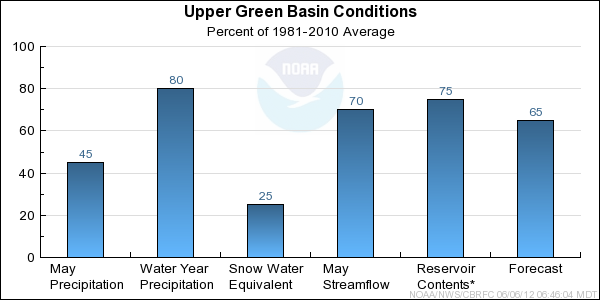
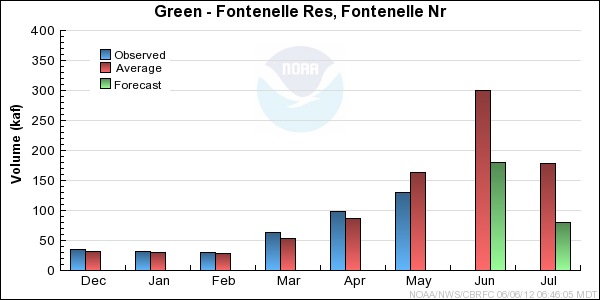
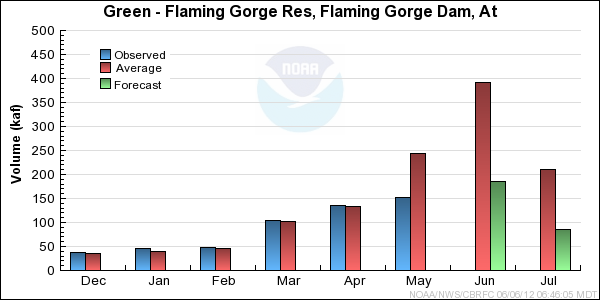
Upper Green Basin Conditions
The following conditions influenced this month's forecasts:
Precipitation:
Seasonal October through May
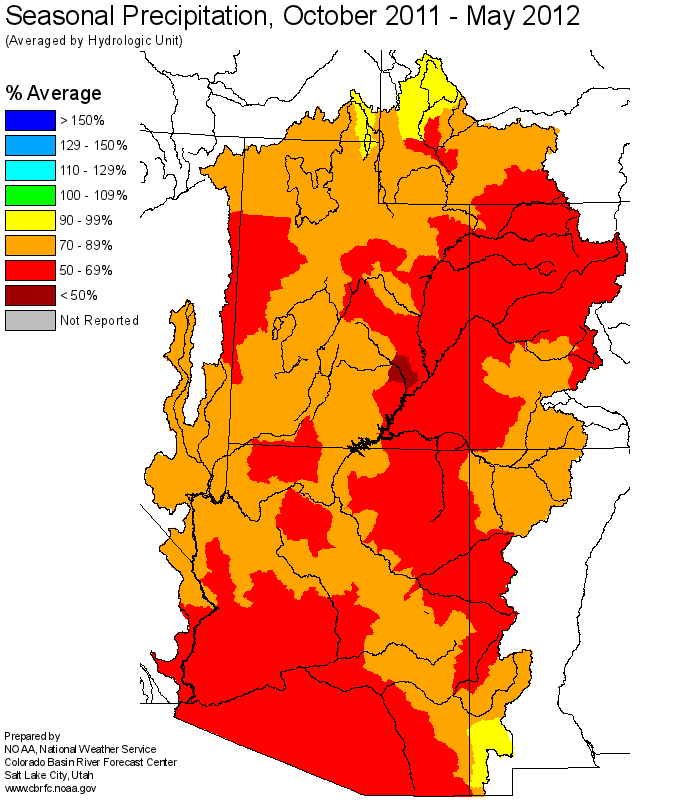
precipitation was 80 percent of average
in the Upper Green basin as a whole. May
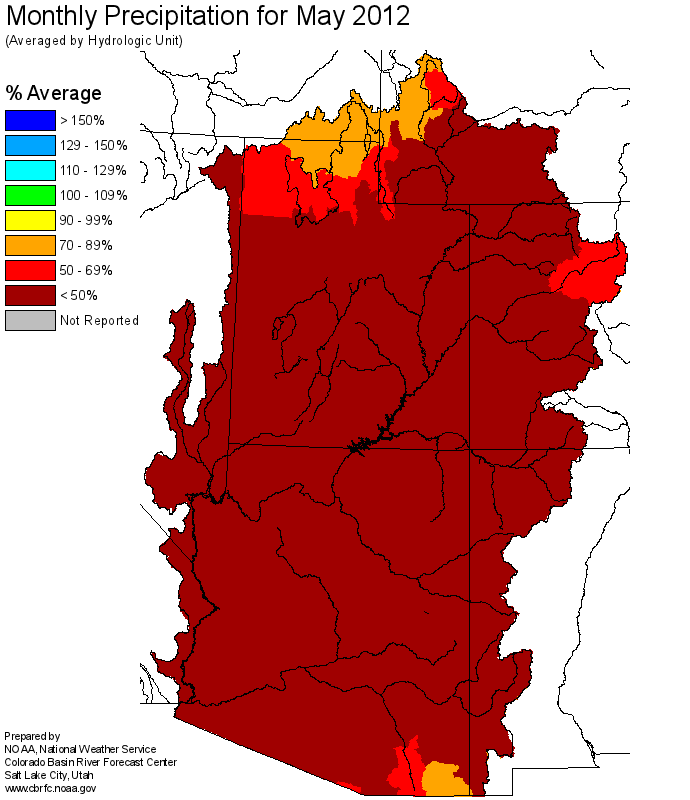
precipitation was 45 percent of average.
May was the third month in a row with much below average precipitation.
Snow:
On June 1st, only two SNOTEL locations in the Upper Green had any remaining snow.
The snow water equivalent for these two sites was 25 percent of average. As of June
5th, these locations have melted out. It is important to note that the highest
measuring location is at 9800 feet in the Upper Green; however, the basin extends
to elevations up to 13,000 feet. Nearly half of the basin is not represented by
the SNOTEL network. It is possible there is still small amounts of remaining snow
at the highest elevations.
--- Upper Green basin
snow
water equivalent plot.
Streamflow:
May streamflow was near 70 percent of average.
Soil Moisture:
Modeled
soil
moisture states indicated near average to above average soil moisture conditions
last fall prior to snow accumulation.
Climate Forecasts:
Climate forecasts were not a factor because there is not a strong correlation
between La Nina conditions and winter precipitation in the Upper Green basin.
Forecast Summary:
The Upper Green had above average and much above average precipitation in October, November,
January, and February. However, warm and dry conditions persisted from March through May resulting
in decreased snow accumulation and early snowmelt. As a result of the warm and dry
spring, the seasonal runoff forecasts have been continually reduced since March.
Current April through July streamflow volume forecasts in the Upper Green have
decreased by 5 to 15 percent since May. Forecasts for locations on the
North Slope of the Uintas are in the bottom three of the historical record. April through
July forecasts now range between 47 and 83 percent of average with a median value of 65 percent.
* Percent usable capacity, not percent average contents.
Click for multi-month Graph.
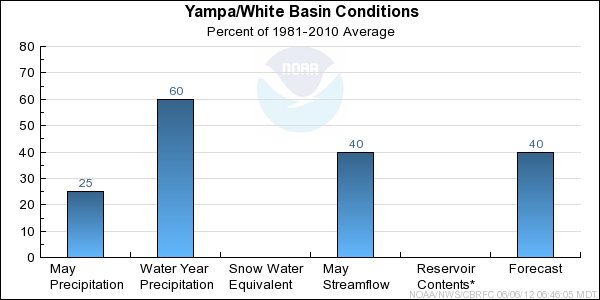
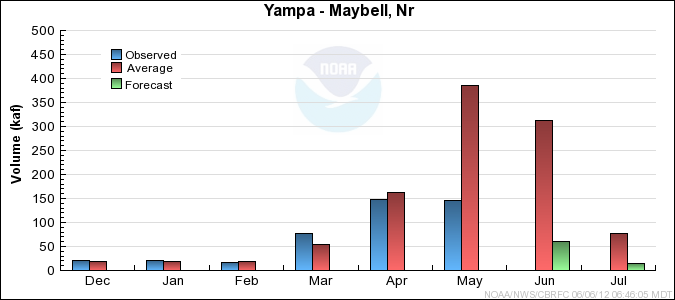
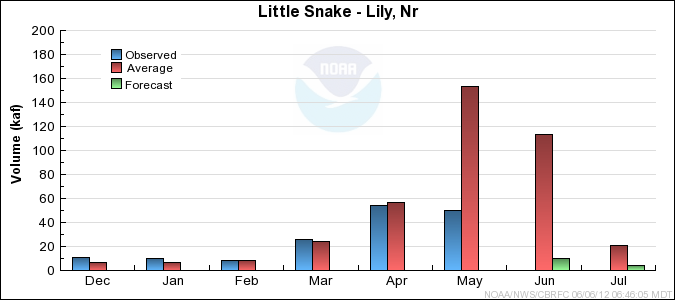
Yampa/White Basin Conditions
The following conditions influenced this month's forecasts:
Precipitation:
Seasonal October through May
precipitation was 60 percent of average
in the Yampa/White basin. May
precipitation was near 25 percent of average.
May was the third month in a row with much below average precipitation.
Snow:
The snow had melted out of nearly all the SNOTEL measuring locations by June 1st. Many of these locations
had record or near record early melt out dates.
--- Yampa basin
snow
water equivalent plot.
Streamflow:
May streamflow was 40 percent of average over the basin as a whole.
Soil Moisture:
Modeled
soil
moisture states indicated above average to much above average soil moisture conditions
last fall prior to snow accumulation.
Climate Forecasts:
Climate forecasts were not a factor in the forecasts because there is not a strong correlation
between La Nina conditions and winter precipitation in the Yampa/White basin.
Forecast Summary:
Near average precipitation in October and November was followed by multiple months, with the
exception of February, of much below average precipitation and above normal temperatures.
These conditions lead to decreased snow accumulation and record early snowmelt in the Yampa
River Basin. As a result of the unseasonably warm and dry spring, seasonal runoff
forecasts have continually decreased since March. Current April through July streamflow volume
forecasts in the Yampa have decreased by 10 to 20 percent since May.
Many of the April through July forecasts are in the bottom five of the historical record.
April through July forecasts now range between 25 and 53 percent of average
with a median value of 38 percent.
* Percent usable capacity, not percent average contents.
Click for multi-month Graph.
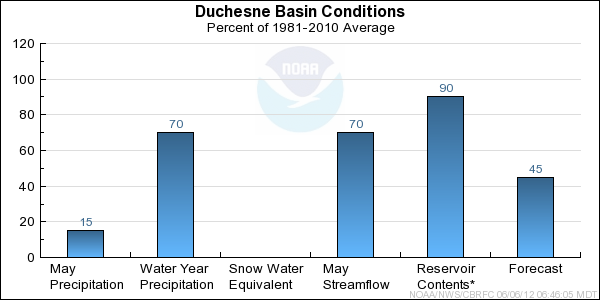
Duchesne Basin Conditions
The following conditions influenced this month's forecasts:
Precipitation:
Seasonal October through May
precipitation was 70 percent of average
in the Duchesne basin. May
precipitation was 15 percent of average.
May was the third month in a row with much below average precipitation.
Snow:
The snow had melted out of nearly all the SNOTEL measuring locations by June 1st. Many of these locations
had record or near record early melt out dates.
--- Duchesne basin
snow
water equivalent plot.
Streamflow:
May streamflow was near 70 percent of average over the basin as a whole. However, some low elevation
locations had monthly volumes less than 50 percent of average.
Soil Moisture:
Modeled
soil
moisture states indicated much above average soil moisture conditions
last fall prior to snow accumulation.
Climate Forecasts:
Climate forecasts were not a factor in the forecasts because there is not a strong correlation
between La Nina conditions and winter precipitation in the Duchesne basin.
Forecast Summary:
A wet October was followed by multiple months of below to much below average precipitation
in the Duchesne basin. Warm and dry conditions persisted from March through May resulting
in decreased snow accumulation and early snowmelt. As a result of the unseasonably warm and
dry spring, seasonal runoff forecasts have continually decreased since March. Current April
through July streamflow volume forecasts in the Duchesne have again decreased by 10 to 20 percent
April through July forecasts now range between 11 and 56 percent of average with
a median value of 44 percent.
* Percent usable capacity, not percent average contents.
Click for multi-month Graph.
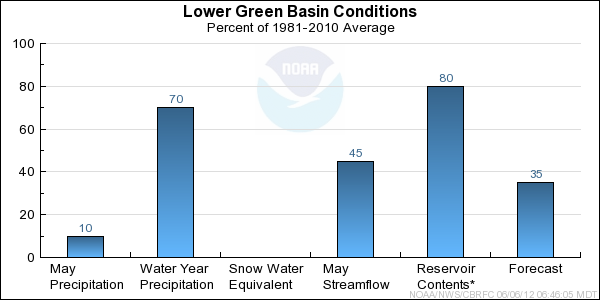
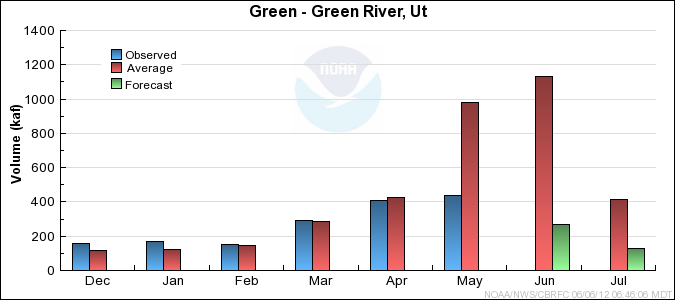
Lower Green Basin Conditions
The following conditions influenced this month's forecasts:
Precipitation:
Seasonal October through May
precipitation was 70 percent of average
in the Lower Green basin. May
precipitation was 10 percent of average.
May was the third month in a row with much below average precipitation.
Snow:
The SNOTEL locations have been melted out since late April in the Lower Green. All of the
snow in the Lower Green has melted. Many of these locations
had record or near record early melt out dates.
--- Lower Green basin
snow
water equivalent plot.
Streamflow:
May streamflow was near 45 percent of average over the basin as a whole.
Soil Moisture:
Modeled
soil
moisture states indicated near average to above average soil moisture conditions
last fall prior to snow accumulation.
Climate Forecasts:
Climate forecasts were not a factor in the forecasts because there is not a strong correlation
between La Nina conditions and winter precipitation in the Lower Green basin.
Forecast Summary:
A wet October was followed by multiple months of below to much below average precipitation,with the exception
of February, in the Lower Green. Warm and dry conditions persisted from March through May resulting in
decreased snow accumulation and early snowmelt. As a result of the unseasonably warm and dry spring, seasonal
runoff forecasts have continually decreased since March. Current April through July streamflow volume forecasts
in the Lower Green have again decreased by 10 to 15 percent. Many of the forecasts in the Lower Green are in the
bottom five of the historical record. April through July forecasts now range between 15 and 43 percent of average with
a median value of 36 percent.
* Percent usable capacity, not percent average contents.
Click for multi-month Graph.
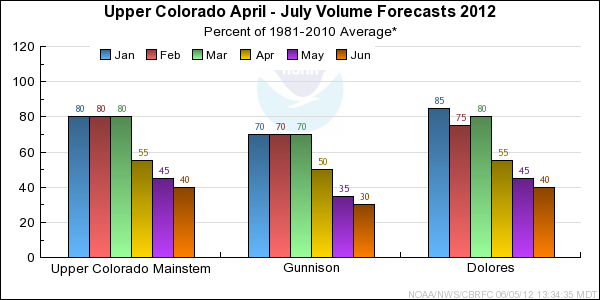
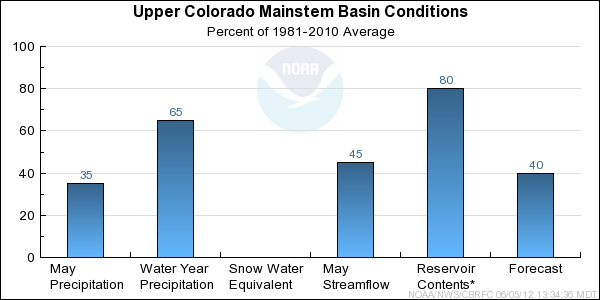
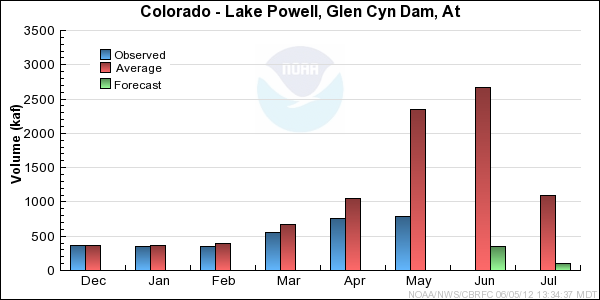
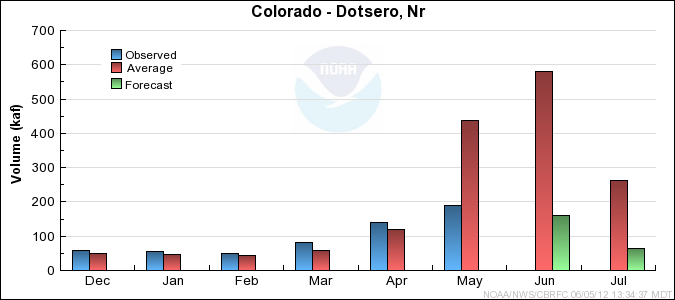
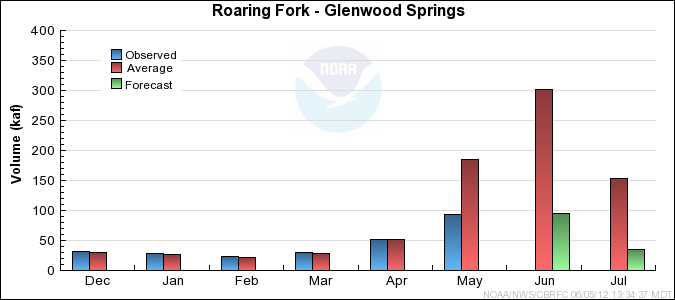
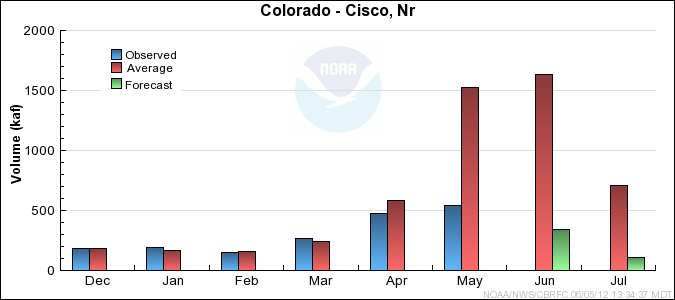
Upper Colorado Mainstem Basin Conditions
The following conditions influenced this month's forecasts:
Precipitation:
Seasonal October through May
precipitation
was near 65 percent of average in the Upper Colorado mainstem basin.
May was the third month in a row with much below average
precipitation
coming in at just 35 percent of average.
Snow:
As of June 1st there was essentially no snow left at any of the SNOTEL sites within the
Upper Colorado mainstem basin. Many of these sites melted out at the earliest time in their
30 year history this year.
--- Upper Colorado basin
snow
water equivalent plot
Streamflow:
May streamflow was much below average in the basin as a whole. Monthly volumes at
individual sites ranged from 20 to 70 percent of average.
Soil Moisture:
Modeled
soil
moisture states were above average heading into the winter.
Climate Forecasts:
La Nina climate conditions existed throughout the winter but these do not show a strong correlation with winter
precipitation in the Upper Colorado mainstem basin, and therefore were not influential in the development
of streamflow volume forecasts.
Forecast Summary:
A wet October was followed by much below average precipitation in November and December. Near average
precipitation occurred in January and February. March, April and May were warm and dry causing
the early meltout of a near record low snowpack. As a result, the seasonal runoff forecasts have been
continually reduced the last few months. Most of the June through July forecasts
are for volumes that would be the 2nd lowest on record if they occurred,
while most of the April through July forecasts would be in the bottom 3 of their historical records.
Current June through July streamflow volume
forecasts
range between 12 and 35 percent of average with a median value of 30 percent.
Current April through July streamflow volume
forecasts
range between 30 and 50 percent of average with a median value of 40 percent.
* Percent usable capacity, not percent average contents.
Click for multi-month Graph.
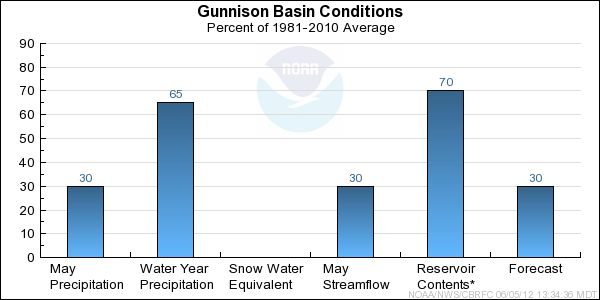
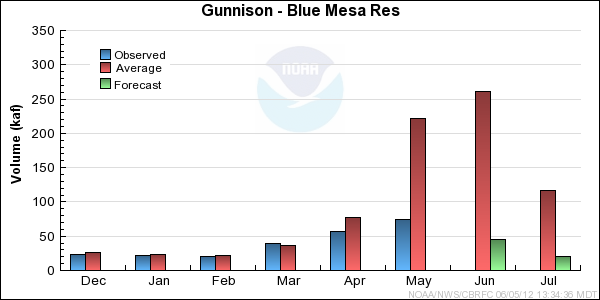
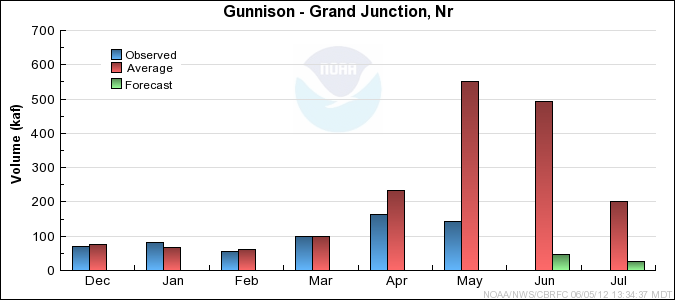
Gunnison Basin Conditions
The following conditions influenced this month's forecasts:
Precipitation:
Seasonal October through May
precipitation ranged from 50 to 80 percent of
average in most of the Gunnison River Basin.
For the third consecutive month very dry conditions were experienced in the Gunnison Basin. May
precipitation ranged from 10 to 50 percent of average at most locations. The
Basin average precipitation was 30 percent of average.
Snow:
The snow had melted out of nearly all measuring sites by June 1st. The snow melt was very
early this season due to the warm dry spring. Many sites were void of snow a full 4 to 6 weeks
earlier than average.
Gunnison Basin
snow
water equivalent plot
Streamflow:
Streamflow volumes for May were much below average due to the lack of snow. Runoff volumes for the
month of May ranged from 25 to 70 percent of average at most locations. Volumes below 20 percent
of average occurred at lower elevation streams where snow had melted out during April.
Soil Moisture:
Modeled
soil
moisture states were above average entering the winter season.
Climate Forecasts:
La Nina climate conditions existed throughout the winter but these do not show a strong
correlation with winter precipitation or Apri-July runoff volumes in the Gunnison Basin.
Therefore they were not influential in the development of streamflow volume forecasts.
Forecast Summary:
The 2012 season was defined by extremely dry and warm conditions during the spring, with record
or near record low snow amounts due the dry conditions and early snow melt. Seasonal runoff
forecasts were progressively reduced throughout the season as the dry conditions persisted.
Forecast runoff volumes were reduced slightly from those issued in early May. Several April-July
forecasts are the 2nd or 3rd lowest on record. For June-July many some volume forecasts are
the lowest on record.Record Seasonal April-July
streamflow runoff volumes
are expected to range from near 10 to 50 percent of the 1981-2010 average. June-July
streamflow runoff
volumes are expected to range from near 5 to 30 percent of average.
* Percent usable capacity, not percent average contents.
Click for multi-month Graph.
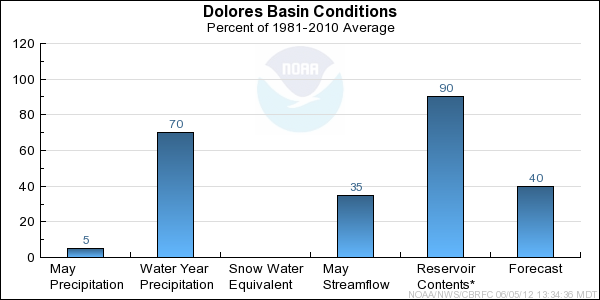
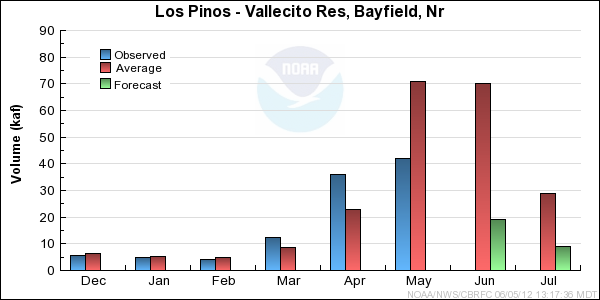
Dolores Basin Conditions
The following conditions influenced this month's forecasts:
Precipitation:
Seasonal October through May
precipitation ranged between 60 and
85 percent of average at most locations in the Dolores Basin.
May was the third consecutive month with very dry conditions in the Dolores Basin. May
precipitation ranged from 0 to 15 percent of average at most locations. The
Basin average precipitation was near 5 percent of average.
Snow:
The snow had melted out of nearly all measuring sites by June 1st. The snow melt was very
early this season due to the warm dry spring. Many sites were void of snow a full 4 to 6 weeks
earlier than average.
Dolores Basin
snow
water equivalent plot
Streamflow:
Streamflow volumes for May ranged from 35 to 65 percent of average in the Dolores Basin.
Soil Moisture:
Modeled
soil
moisture states were near average entering the winter season.
Climate Forecasts:
La Nina climate conditions existed throughout the winter but these do not show a strong correlation
with winter precipitation or April-July runoff volumes in the Dolores Basin. Therefore,
it was not influential in the development of streamflow volume forecasts.
Forecast Summary:
The 2012 season was defined by extremely dry and warm conditions during the spring, with record
or near record low snow amounts due the dry conditions and early snow melt. Seasonal runoff
forecasts were progressively reduced throughout the season as the dry conditions persisted.
Forecast runoff volumes were reduced slightly from those issued in early May. Some forecasts
are among the bottom 5 on record. Forecast April-July
streamflow
runoff volumes are expected to range from 30 to 45 percent of the 1981-2010 average. June-July
streamflow runoff volumes are expected to range between 15 and 30
percent of average.
* Percent usable capacity, not percent average contents.
Click for multi-month Graph.
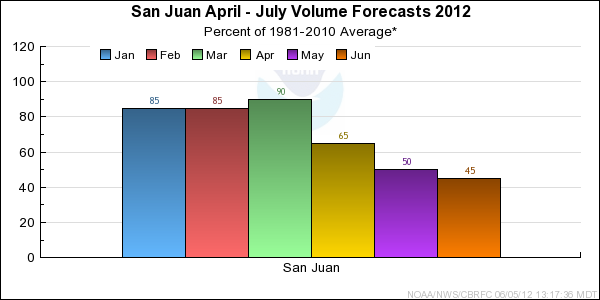
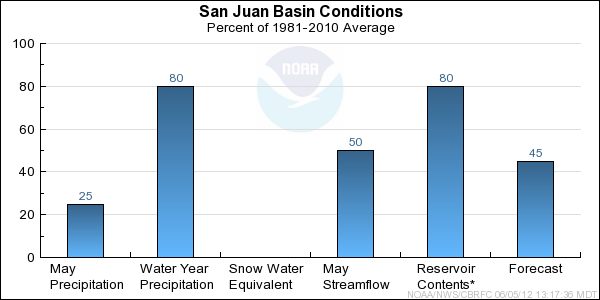
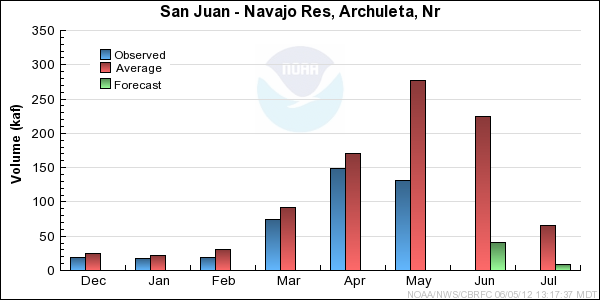
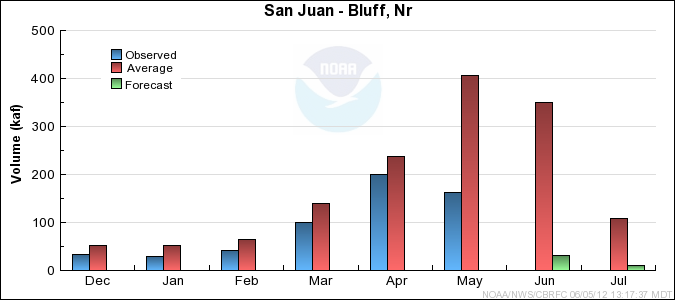
San Juan Basin Conditions
The following conditions influenced this month's forecasts:
Precipitation:
Seasonal October through May
precipitation was between 65 to 85 percent of average at
most locations in the San Juan Basin.
May was the third consecutive month with very dry conditions.
Precipitation in May ranged from 0 to near
55 percent of average over most of the San Juan Basin. The Basin average from the month of May was 25%
of average.
Snow:
Snow melted off at measuring sites by early June. The warm and dry spring caused snow to melt out a full
4 to 6 weeks early at many locations.
Animas River Basin
Snow Plot.
San Juan Basin (above Navajo Reservoir)
Snow Plot.
Streamflow:
Streamflow volumes were much below average in May due to the lack of snow. Runoff volumes in May ranged from 40 to 60 percent
of average.
Soil Moisture:
Modeled
soil moisture was near to above
average at highest elevations entering the winter season. Below average soil moisture conditions existed
over the southern half of the basin and in tributaries further downstream.
Climate Forecasts:
La Nina climate conditions existed through the winter months. The La Nina climate condition suggests drier
than average conditions possible over the San Juan Basin. The La Nina climate condition was considered when
developing the forecasts.
Forecast Summary:
The 2012 season was defined by very dry and warm conditions that persisted throughout the spring that
resulted in a very early snow melt. At times during the spring the snow pack was at record or near
record low levels due to the dry and warm conditions. Runoff volume forecasts were reduced as the season
progressed and the dry conditions persisted. Forecasts have been reduced slightly from those issued
in early May and some are in the bottom 5 of the historical record. April-July
runoff volumes
are expected to range from 35 to 55 percent of the 1981-2010 average. June-July
runoff volumes volumes are expected to range from near 10 to 30 percent of average.
* Percent usable capacity, not percent average contents.
Click for multi-month Graph.
Differences between the full period forecasts and the residual forecasts may not exactly equal the actual observed volumes due to rounding conventions (see Definitions section).
Reservoir Monthly Inflow Forecasts
Monthly Streamflows
Precipitation Maps