
NOAA, National Weather Service
Colorado Basin River Forecast Center
Salt Lake City, Utah
www.cbrfc.noaa.gov
| Prepared by Brenda Alcorn, Tracy Cox NOAA, National Weather Service Colorado Basin River Forecast Center Salt Lake City, Utah www.cbrfc.noaa.gov |
| Forecast Period | 90% Exceedance Volume | 50% Exceedance Volume | Percent Average | 10% Exceedance Volume | |
| Colorado | |||||
| Lake Granby, Granby, Nr | April-July | 230 | 305 | 136 | 390 |
| Willow Ck | |||||
| Willow Ck Res, Granby, Nr | April-July | 50 | 70 | 137 | 99 |
| Fraser | |||||
| Winter Park | April-July | 17.5 | 23 | 115 | 28 |
| Williams Fork | |||||
| Williams Fork Res, Parshall, Nr | April-July | 84 | 115 | 121 | 151 |
| Muddy Ck | |||||
| Wolford Mtn Res, Blo | April-July | 54 | 80 | 133 | 111 |
| Blue | |||||
| Dillon Res | April-July | 154 | 210 | 126 | 275 |
| Green Mtn Res | April-July | 255 | 350 | 125 | 460 |
| Colorado | |||||
| Kremmling, Nr | April-July | 870 | 1150 | 132 | 1500 |
| Eagle | |||||
| Gypsum, Blo | April-July | 290 | 400 | 119 | 525 |
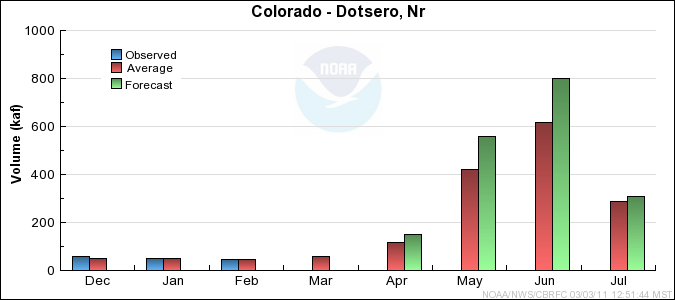
| Colorado | |||||
| Dotsero, Nr | April-July | 1370 | 1820 | 126 | 2430 |
| Frying Pan | |||||
| Ruedi Res, Basalt, Nr | April-July | 122 | 165 | 117 | 215 |
| Roaring Fork | |||||
| Glenwood Springs | April-July | 665 | 850 | 120 | 1060 |
| Colorado | |||||
| Glenwood Springs, Blo | April-July | 2050 | 2670 | 124 | 3400 |
| Cameo, Nr | April-July | 2300 | 3020 | 125 | 3900 |
| Plateau Ck | |||||
| Cameo, Nr | April-July | 105 | 160 | 139 | 225 |
| Colorado | |||||
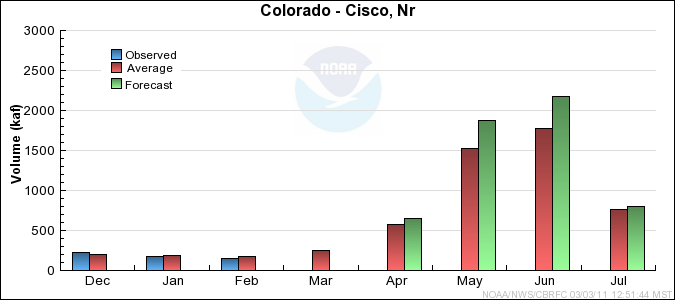
| Cisco, Nr | April-July | 3800 | 5500 | 118 | 7400 |
| Mill Ck | |||||
| Moab, Nr, Sheley Tun, At | April-July | 3 | 4.8 | 96 | 7.3 |
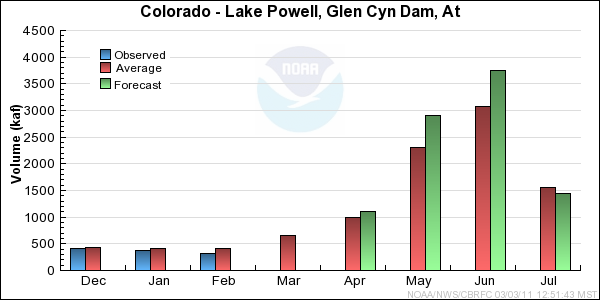
| Colorado | |||||
| Lake Powell, Glen Cyn Dam, At | April-July | 6200 | 9200 | 116 | 12500 |
| Forecast Period | 90% Exceedance Volume | 50% Exceedance Volume | Percent Average | 10% Exceedance Volume | |
| Taylor | |||||
| Taylor Park Res | April-July | 90 | 120 | 117 | 155 |
| Almont | April-July | 150 | 198 | 120 | 250 |
| East | |||||
| Almont | April-July | 179 | 230 | 120 | 290 |
| Gunnison | |||||
| Gunnison, Nr | April-July | 345 | 460 | 118 | 590 |
| Tomichi Ck | |||||
| Gunnison | April-July | 41 | 80 | 99 | 137 |
| Lake Fork | |||||
| Gateview | April-July | 97 | 130 | 103 | 168 |
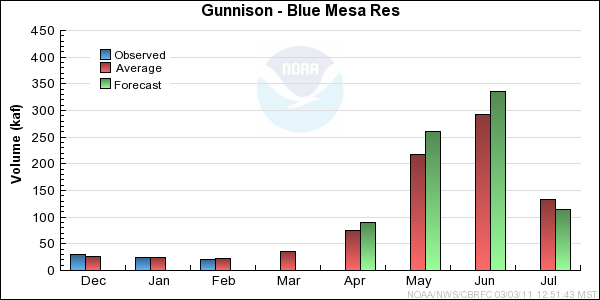
| Gunnison | |||||
| Blue Mesa Res | April-July | 590 | 800 | 111 | 1040 |
| Morrow Point Res | April-July | 590 | 875 | 111 | 1100 |
| Crystal Res | April-July | 750 | 985 | 108 | 1300 |
| Muddy Ck | |||||
| Paonia Res, Bardine, Nr | March-June | 89 | 126 | 126 | 170 |
| April-July | 87 | 129 | 126 | 180 | |
| Nf Gunnison | |||||
| Somerset, Nr | April-July | 285 | 370 | 121 | 465 |
| Surface Ck | |||||
| Cedaredge | April-July | 14.7 | 21 | 123 | 29 |
| Uncompahgre | |||||
| Ridgway Res | April-July | 71 | 105 | 103 | 145 |
| Colona | April-July | 81 | 140 | 101 | 215 |
| Delta | April-July | 68 | 120 | 103 | 182 |
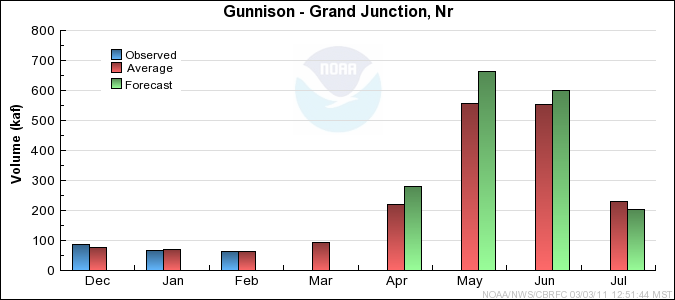
| Gunnison | |||||
| Grand Junction, Nr | April-July | 1200 | 1750 | 112 | 2300 |
| Forecast Period | 90% Exceedance Volume | 50% Exceedance Volume | Percent Average | 10% Exceedance Volume | |
| Dolores | |||||
| Dolores | April-July | 137 | 220 | 83 | 305 |
| Mcphee Res | April-July | 162 | 255 | 80 | 370 |
| San Miguel | |||||
| Placerville, Nr | April-July | 74 | 110 | 83 | 156 |
| Dolores | |||||
| Cisco, Nr | April-July | 340 | 540 | 88 | 730 |
| Range | Round to | |
| 0-1.99 | 0.01 | |
| 2.0-19.9 | 0.1 | |
| 20-199 | 1.0 | |
| 200-999 | 5.0 | |
| 1000+ | 3 significant digits |
