NOAA, National Weather Service
Colorado Basin River Forecast Center
Salt Lake City, Utah
www.cbrfc.noaa.gov
| Prepared by Brenda Alcorn, Greg Smith NOAA, National Weather Service Colorado Basin River Forecast Center Salt Lake City, Utah www.cbrfc.noaa.gov |
| Forecast Period | 90% Exceedance Volume | 70% Exceedance Volume | 50% Exceedance Volume | Percent Average | 30% Exceedance Volume | 10% Exceedance Volume | |
| Colorado | |||||||
| Lake Granby, Granby, Nr | April-July | 215 | 230 | 240 | 109 | 255 | 275 |
| June-July | 130 | 143 | 154 | 106 | 170 | 190 | |
| Willow Ck | |||||||
| Willow Ck Res, Granby, Nr | April-July | 59 | 62 | 65 | 138 | 72 | 75 |
| June-July | 14 | 17 | 20 | 95 | 27 | 30 | |
| Fraser | |||||||
| Winter Park | April-July | 18 | 19.5 | 21 | 108 | 23 | 25 |
| June-July | 13.5 | 15 | 16.5 | 116 | 18.5 | 20 | |
| Williams Fork | |||||||
| Williams Fork Res, Parshall, Nr | April-July | 90 | 95 | 105 | 109 | 110 | 117 |
| June-July | 63 | 68 | 78 | 120 | 83 | 90 | |
| Muddy Ck | |||||||
| Wolford Mountain Reservoir | April-July | 36 | 38 | 42 | 78 | 46 | 49 |
| June-July | 7 | 9.1 | 13.1 | 68 | 17.1 | 20 | |
| Blue | |||||||
| Dillon Res | April-July | 160 | 175 | 185 | 113 | 195 | 205 |
| June-July | 109 | 124 | 134 | 122 | 144 | 154 | |
| Green Mtn Res | April-July | 260 | 285 | 305 | 111 | 320 | 340 |
| June-July | 170 | 194 | 215 | 117 | 230 | 250 | |
| Colorado | |||||||
| Kremmling, Nr | April-July | 850 | 900 | 950 | 110 | 1030 | 1070 |
| June-July | 480 | 530 | 580 | 110 | 660 | 700 | |
| Eagle | |||||||
| Gypsum, Blo | April-July | 255 | 265 | 290 | 87 | 315 | 330 |
| June-July | 165 | 173 | 198 | 92 | 225 | 240 | |
| Colorado | |||||||
| Dotsero, Nr | April-July | 1300 | 1350 | 1410 | 101 | 1500 | 1600 |
| June-July | 750 | 800 | 860 | 102 | 950 | 1050 | |
| Frying Pan | |||||||
| Ruedi Res, Basalt, Nr | April-July | 110 | 115 | 125 | 90 | 135 | 140 |
| June-July | 66 | 71 | 81 | 91 | 91 | 96 | |
| Roaring Fork | |||||||
| Glenwood Springs | April-July | 580 | 615 | 650 | 94 | 690 | 720 |
| June-July | 390 | 425 | 460 | 101 | 500 | 530 | |
| Colorado | |||||||
| Glenwood Springs, Blo | April-July | 1900 | 2000 | 2070 | 98 | 2250 | 2350 |
| June-July | 1150 | 1250 | 1320 | 102 | 1500 | 1600 | |
| Cameo, Nr | April-July | 2000 | 2140 | 2220 | 94 | 2390 | 2550 |
| June-July | 1210 | 1350 | 1430 | 101 | 1600 | 1760 | |
| Plateau Ck | |||||||
| Cameo, Nr | April-July | 60 | 65 | 75 | 60 | 80 | 90 |
| June-July | 15 | 20 | 30 | 61 | 35 | 45 | |
| Colorado | |||||||
| Cisco, Nr | April-July | 3900 | 4100 | 4310 | 97 | 4500 | 4700 |
| June-July | 1990 | 2190 | 2400 | 103 | 2590 | 2790 | |
| Lake Powell, Glen Cyn Dam, At | April-July | 7400 | 8000 | 8300 | 116 | 8600 | 9200 |
| June-July | 3410 | 4010 | 4310 | 115 | 4610 | 5210 |
| Forecast Period | 90% Exceedance Volume | 70% Exceedance Volume | 50% Exceedance Volume | Percent Average | 30% Exceedance Volume | 10% Exceedance Volume | |
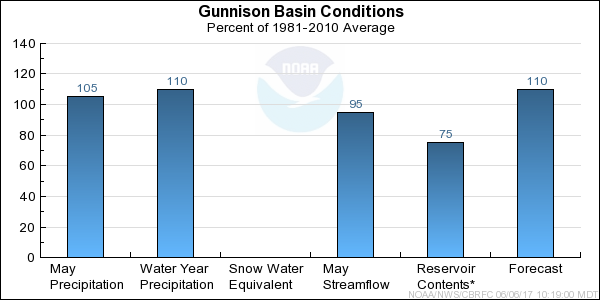
| Taylor | |||||||
| Taylor Park Res | April-July | 103 | 106 | 109 | 110 | 114 | 119 |
| June-July | 61 | 64 | 67 | 108 | 72 | 77 | |
| Almont | April-July | 167 | 171 | 175 | 113 | 181 | 187 |
| June-July | 95 | 99 | 103 | 110 | 109 | 115 | |
| East | |||||||
| Almont | April-July | 215 | 220 | 225 | 124 | 230 | 240 |
| June-July | 116 | 121 | 126 | 119 | 131 | 141 | |
| Gunnison | |||||||
| Gunnison, Nr | April-July | 440 | 445 | 455 | 123 | 470 | 480 |
| June-July | 235 | 240 | 250 | 116 | 265 | 275 | |
| Tomichi Ck | |||||||
| Gunnison | April-July | 100 | 105 | 109 | 147 | 113 | 116 |
| June-July | 42 | 47 | 51 | 138 | 55 | 58 | |
| Lake Fork | |||||||
| Gateview | April-July | 127 | 133 | 138 | 112 | 143 | 151 |
| June-July | 85 | 91 | 96 | 119 | 101 | 109 | |
| Gunnison | |||||||
| Blue Mesa Res | April-July | 810 | 825 | 840 | 124 | 855 | 880 |
| June-July | 420 | 435 | 450 | 118 | 465 | 490 | |
| Morrow Point Res | April-July | 875 | 890 | 905 | 122 | 920 | 945 |
| June-July | 455 | 470 | 485 | 120 | 500 | 525 | |
| Crystal Res | April-July | 940 | 980 | 995 | 119 | 1010 | 1040 |
| June-July | 490 | 530 | 545 | 121 | 560 | 585 | |
| Muddy Ck | |||||||
| Paonia Res, Bardine, Nr | March-June | 64 | 66 | 68 | 71 | 70 | 73 |
| April-July | 58 | 60 | 62 | 64 | 64 | 67 | |
| June-June | 11 | 13 | 15 | 65 | 17 | 20 | |
| June-July | 15 | 17 | 19 | 66 | 21 | 24 | |
| Nf Gunnison | |||||||
| Somerset, Nr | April-July | 245 | 250 | 255 | 86 | 260 | 265 |
| June-July | 83 | 89 | 93 | 82 | 98 | 103 | |
| Surface Ck | |||||||
| Cedaredge | April-July | 12.1 | 12.6 | 13.1 | 78 | 15.6 | 16.1 |
| June-July | 3 | 3.5 | 4 | 53 | 6.5 | 7 | |
| Uncompahgre | |||||||
| Ridgway Res | April-July | 91 | 95 | 98 | 97 | 104 | 109 |
| June-July | 59 | 63 | 66 | 102 | 72 | 77 | |
| Colona | April-July | 123 | 126 | 131 | 96 | 137 | 146 |
| June-July | 75 | 78 | 83 | 102 | 89 | 98 | |
| Delta | April-July | 108 | 111 | 115 | 102 | 121 | 131 |
| June-July | 52 | 55 | 59 | 104 | 65 | 75 | |
| Gunnison | |||||||
| Grand Junction, Nr | April-July | 1540 | 1550 | 1570 | 106 | 1610 | 1640 |
| June-July | 740 | 755 | 775 | 112 | 815 | 840 |
| Forecast Period | 90% Exceedance Volume | 70% Exceedance Volume | 50% Exceedance Volume | Percent Average | 30% Exceedance Volume | 10% Exceedance Volume | |
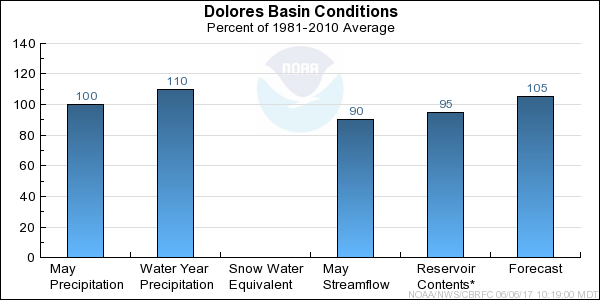
| Dolores | |||||||
| Dolores | April-July | 275 | 280 | 285 | 116 | 290 | 300 |
| June-July | 84 | 90 | 95 | 103 | 100 | 111 | |
| Mcphee Res | April-July | 310 | 320 | 325 | 110 | 330 | 340 |
| June-July | 87 | 94 | 100 | 103 | 107 | 117 | |
| San Miguel | |||||||
| Placerville, Nr | April-July | 114 | 118 | 121 | 95 | 126 | 132 |
| June-July | 67 | 71 | 74 | 99 | 79 | 85 | |
| Dolores | |||||||
| Cisco, Nr | April-July | 510 | 515 | 520 | 92 | 535 | 550 |
| June-July | 180 | 185 | 189 | 103 | 205 | 220 |
| Range | Round to | |
| 0-1.99 | 0.01 | |
| 2.0-19.9 | 0.1 | |
| 20-199 | 1.0 | |
| 200-999 | 5.0 | |
| 1000+ | 3 significant digits |