New 1981-2010 Averages being used this year.
Note: This publication is currently undergoing major revisions. The current publication will be replaced with a new publication based on stakeholder requirements and scientific advances. We expect to begin sharing details on this soon. If you have input on content, format, or publication frequency at any time, please contact us at cbrfc.webmasters@noaa.gov.Green Water Supply Outlook, January 1, 2012Green Water Supply Outlook, January 1, 2012
Contents
Green Summary
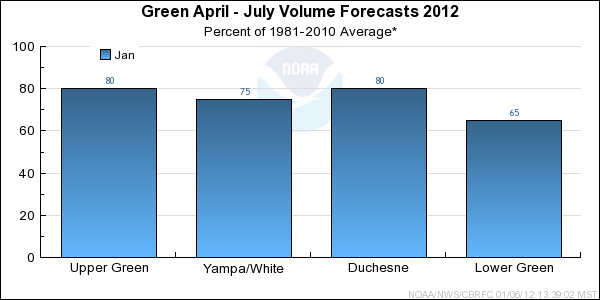
*Median of forecasts within each basin.
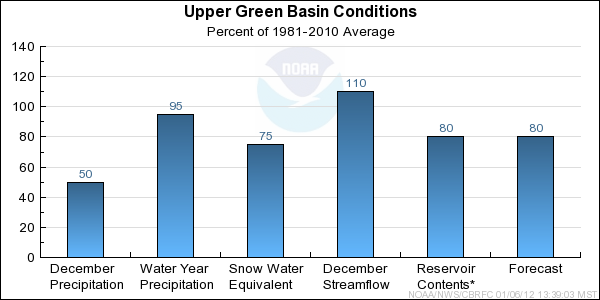
Upper Green Basin Conditions
The following conditions influenced this month's forecasts:
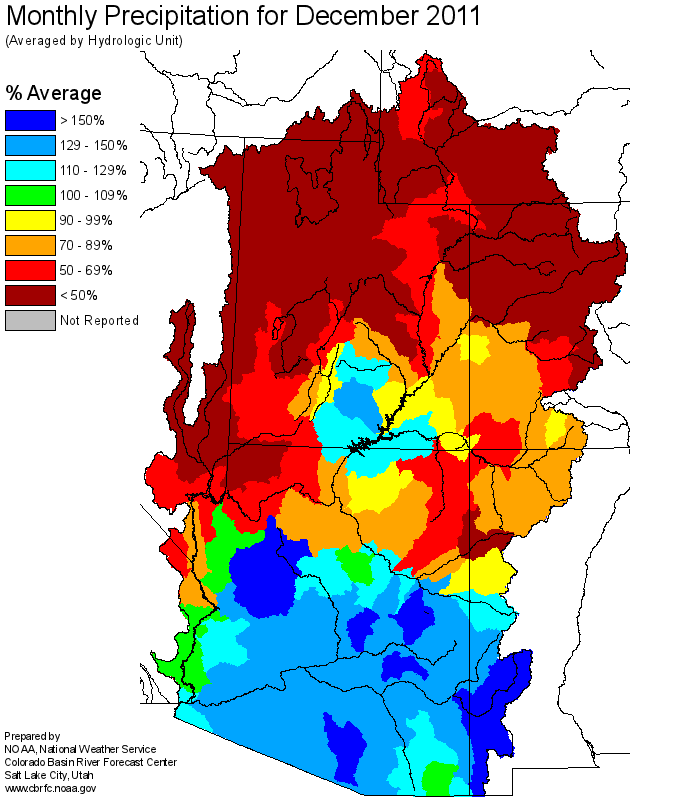
Precipitation:
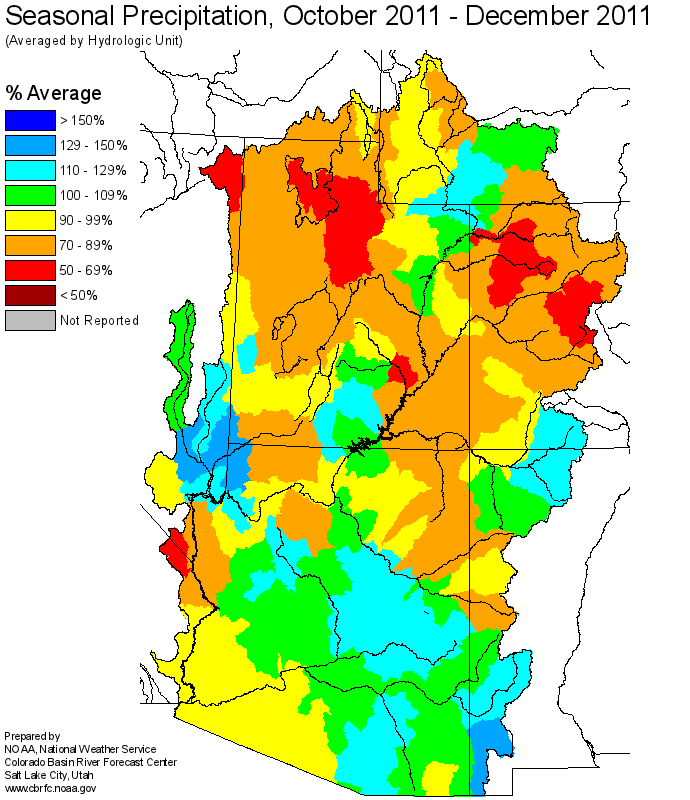
Seasonal October through December
precipitation was 95 percent of average
in the Upper Green basin. December
precipitation was 50 percent of average.
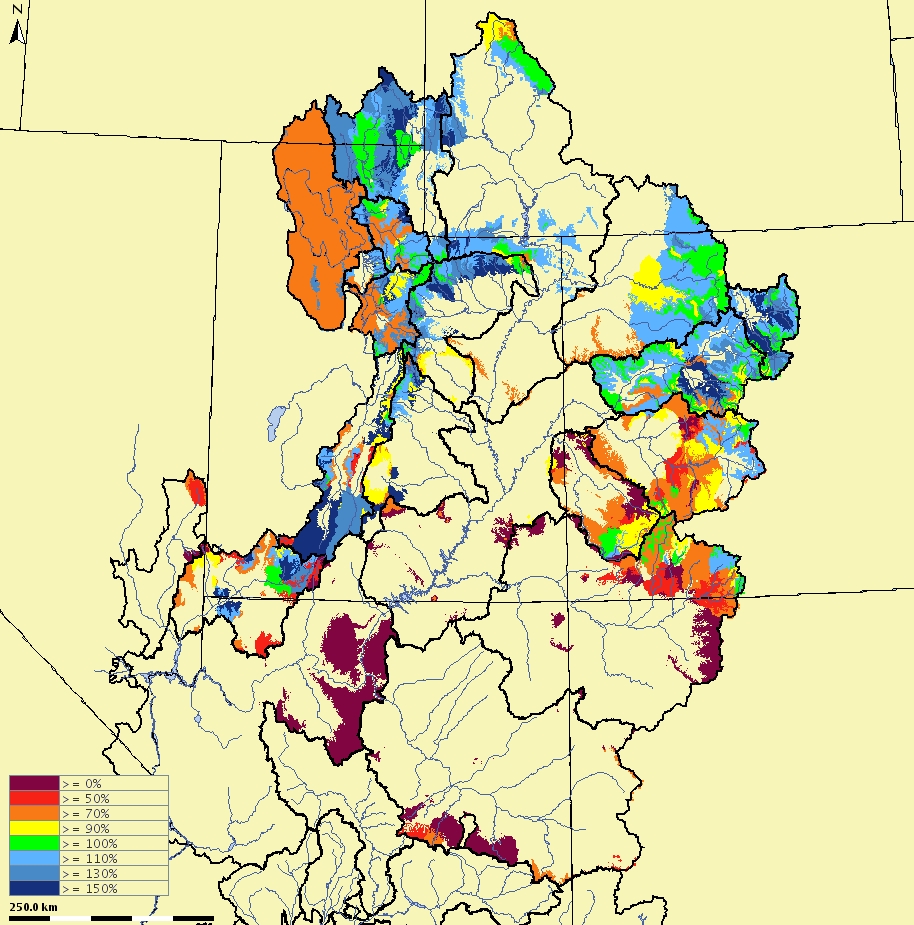
Snow:
January 1st snow water equivalent was 75 percent of average in the basin.
--- Upper Green basin
snow
water equivalent plot.
Streamflow:
December streamflow was near 110 percent of average.
Soil Moisture:
Modeled
soil
moisture states indicated near average to above average soil moisture conditions
last fall prior to snow accumulation.
Climate Forecasts:
Climate forecasts were not a factor because there is not a strong correlation
between La Nina conditions and winter precipitation in the Upper Green basin.
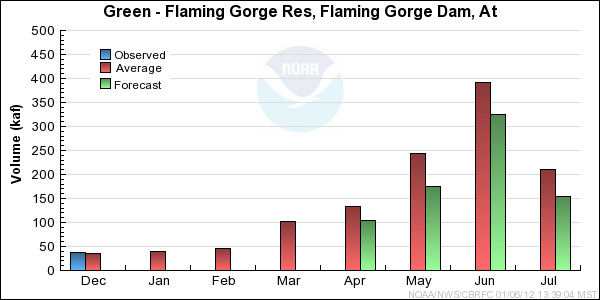
Forecast Summary:
Seasonal precipitation in the Upper Green is near average as a result of much above average precipitation
in October and November. However, snow water equivalent is below average due to much below average
monthly precipitation in December. It is also important to note that fall soil moisture
conditions were near to above average. As a result, current April through July streamflow volume forecasts range
between 65 and 87 percent of average with a median value of 80 percent.
* Percent usable capacity, not percent average contents.
Click for multi-month Graph.
Yampa/White Basin Conditions
The following conditions influenced this month's forecasts:
Precipitation:
Seasonal October through December
precipitation was 70 percent of average
in the Yampa/White basin. December
precipitation was 30 percent of average.
Snow:
January 1st snow water equivalent was 65 percent of average in the basin.
--- Yampa basin
snow
water equivalent plot.
Streamflow:
December streamflow was near 120 percent of average.
Soil Moisture:
Modeled
soil
moisture states indicated above average to much above average soil moisture conditions
last fall prior to snow accumulation.
Climate Forecasts:
Climate forecasts were not a factor in the forecasts because there is not a strong correlation
between La Nina conditions and winter precipitation in the Yampa/White basin.
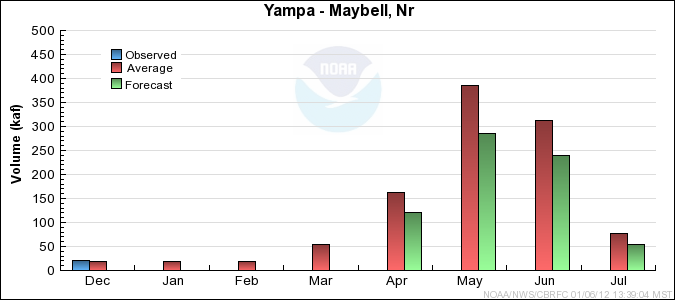
Forecast Summary:
Seasonal precipitation is below average and snow water equivalent is much below average in the Yampa/White basins
as a result of an extremely dry December. It is also important to note that fall soil moisture conditions
were above to much above average. As a result, current April through July streamflow volume forecasts range
between 68 and 83 percent of average with a median value of 75 percent.

* Percent usable capacity, not percent average contents.
Click for multi-month Graph.
Duchesne Basin Conditions
The following conditions influenced this month's forecasts:
Precipitation:
Seasonal October through December
precipitation was 90 percent of average
in the Duchesne basin. December
precipitation was 40 percent of average.
Snow:
January 1st snow water equivalent was 65 percent of average in the basin
as a whole.
--- Duchesne basin
snow
water equivalent plot.
Streamflow:
December streamflow was 120 percent of average.
Soil Moisture:
Modeled
soil
moisture states indicated much above average soil moisture conditions
last fall prior to snow accumulation.
Climate Forecasts:
Climate forecasts were not a factor in the forecasts because there is not a strong correlation
between La Nina conditions and winter precipitation in the Duchesne basin.
Forecast Summary:
Seasonal precipitation in the Duchesne is near average as a result of much above average precipitation
in October and near average precipitation in November. Snow water equivalent is much below average for the
majority of the basin due to much below average monthly precipitation in December. However, the snow water
equivalent for the eastern portion of the basin is near average resulting in somewhat
higher forecasts. It is also important to note that fall soil moisture conditions were
much above average. As a result, current April through July streamflow volume forecasts range between 63 and 104
percent of average with a median value of 80 percent.

* Percent usable capacity, not percent average contents.
Click for multi-month Graph.
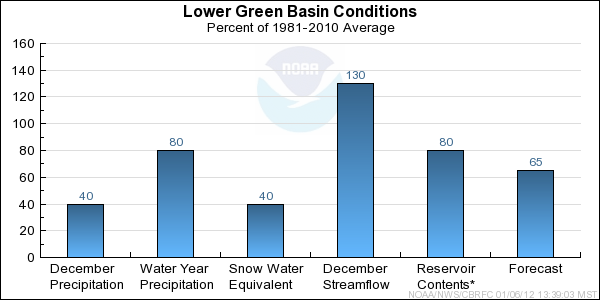
Lower Green Basin Conditions
The following conditions influenced this month's forecasts:
Precipitation:
Seasonal October through December
precipitation was 80 percent of average
in the Lower Green basin. December
precipitation was 40 percent of average.
Snow:
January 1st snow water equivalent was 40 percent of average in the basin
as a whole.
--- Lower Green basin
snow
water equivalent plot.
Streamflow:
December streamflow was near 130 percent of average.
Soil Moisture:
Modeled
soil
moisture states indicated near average to above average soil moisture conditions
last fall prior to snow accumulation.
Climate Forecasts:
Climate forecasts were not a factor in the forecasts because there is not a strong correlation
between La Nina conditions and winter precipitation in the Lower Green basin.
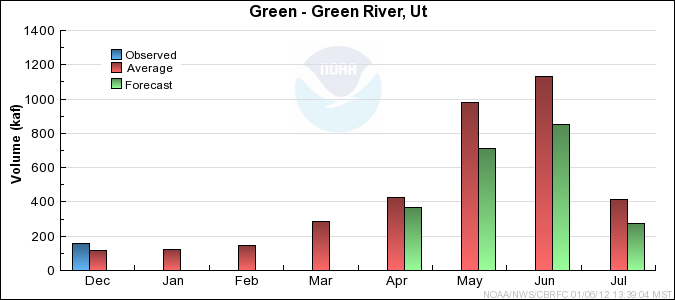
Forecast Summary:
Seasonal precipitation is below average and snow water equivalent is much below average in the Lower Green due to
below average monthly precipitation in November and December. It is also important to note the fall soil moisture
conditions were near to above average. As a result, current April through July streamflow
volume forecasts range between 60 and 75 percent of average with a median value of 65 percent.
* Percent usable capacity, not percent average contents.
Click for multi-month Graph.
Differences between the full period forecasts and the residual forecasts may not exactly equal the actual observed volumes due to rounding conventions (see Definitions section).
Reservoir Monthly Inflow Forecasts
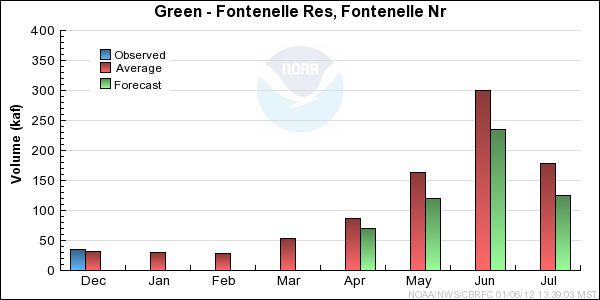
Monthly Streamflows
Precipitation Maps
Hydrologist: Ashley Nielson
