The following conditions influenced this month's forecasts:
Precipitation:
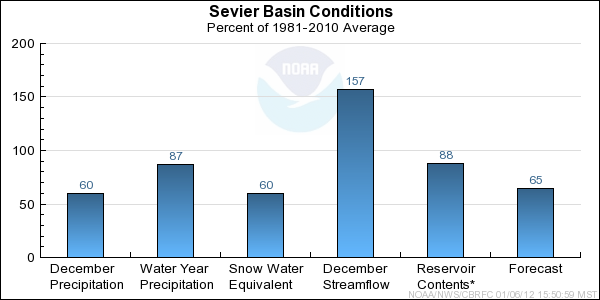
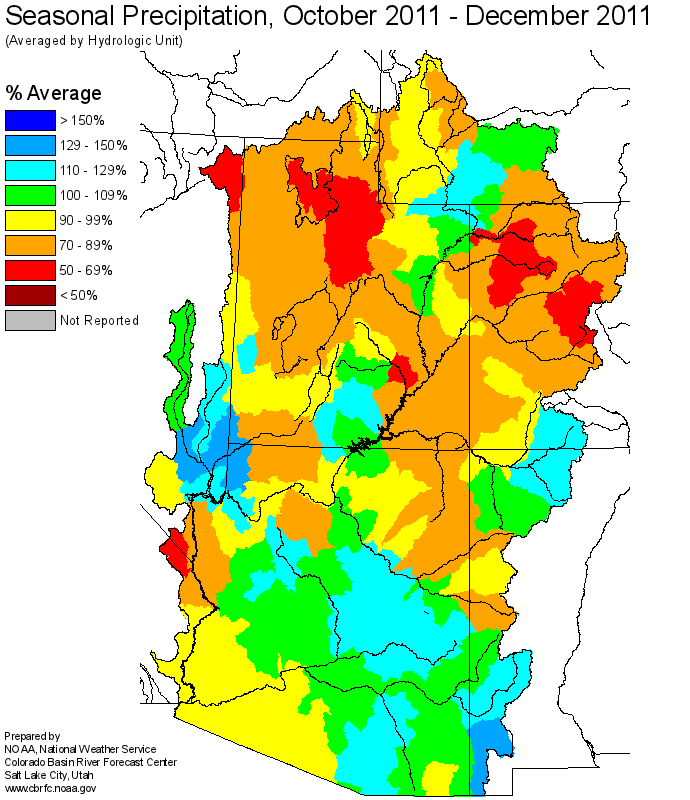
Seasonal October through December
precipitation was 87 percent of average.
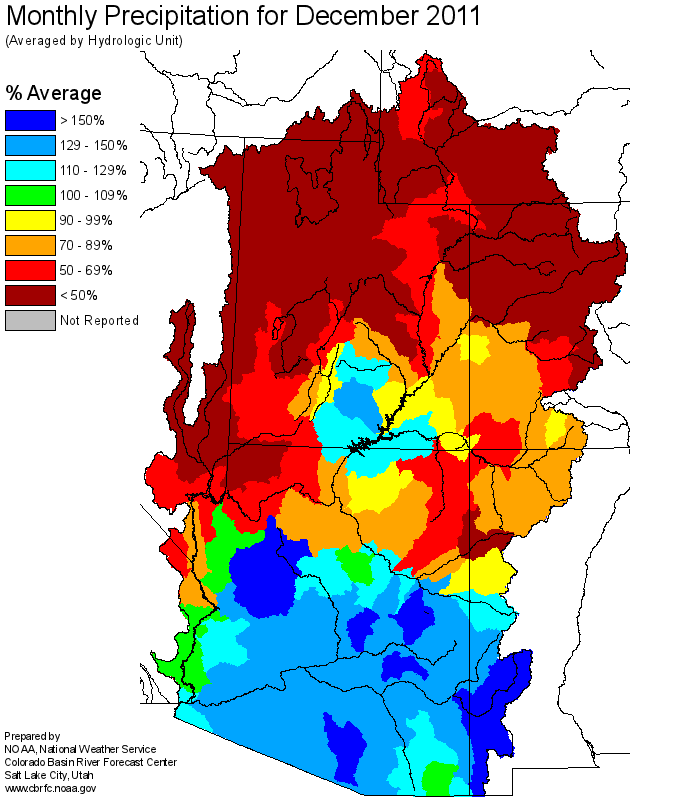
December
precipitation was 60 percent of average.
Streamflow:
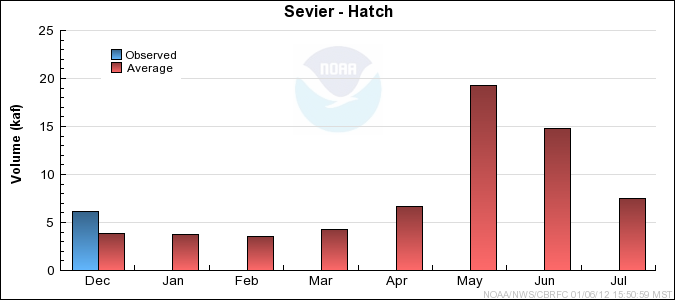
Streamflow for the Sevier River at Hatch was 157 percent of average for December.
Snowpack:
January 1st snow water equivalent was 60 percent of average for the Sevier River Basin.
Sevier River Drainage
Snow Plot.
Sevier River Basin Headwaters
Snow Plot.
Lower Sevier River Basin Below Piute
Snow Plot.
Soil Moisture:
Soil moisture content was above average going into the winter.
Climate Forecasts:
Generally climate scenarios like El Nino and La Nina have a weak to moderate effect in the Sevier River Basin. However, because we lack a good
statistical correlation, these events are not specifically factored into our water supply forecasts.
Forecast Summary:
January 1st snow water equivalent was 60 percent of average for the Sevier River Basin.
December precipitation throughout the Sevier Basin was 60% of average. Seasonal October through December precipitation in the Sevier Basin was below average with 87% of average.
At this time, baseflows are running higher than average due to elevated soil moisture content.
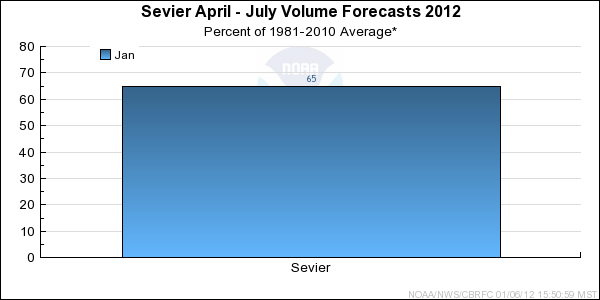
Current
April through July Seasonal volume forecasts
range between 56 to 79 percent of average. The median April through July forecast was 65 percent of average.
The forecasts for the Sevier River at Hatch, the Sevier River near Kingston, the East Fork of the Sevier River, Piute Reservoir, and the Sevier River near Gunnison are 'Regulated or Observed' flow forecasts rather
than 'Natural or Unregulated' forecasts which are corrected for all upstream diversions.
Differences between the full period forecasts and the residual forecasts may not exactly equal the actual observed volumes due to rounding conventions (see Definitions section).