Note: This publication is currently undergoing major revisions. The current publication will be replaced with a new publication based on stakeholder requirements and scientific advances. We expect to begin sharing details on this soon. If you have input on content, format, or publication frequency at any time, please contact us at cbrfc.webmasters@noaa.gov.Lower Colorado Water Supply Outlook, February 1, 2011Lower Colorado Water Supply Outlook, February 1, 2011
Contents
Lower Colorado Summary
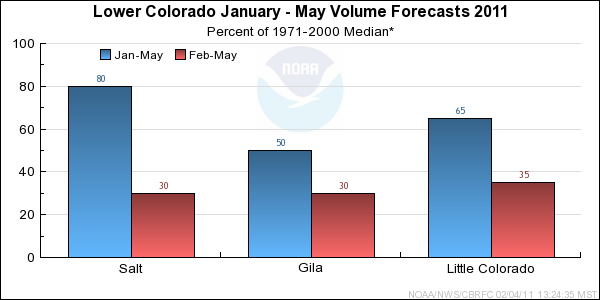
*Median of forecasts within each basin.
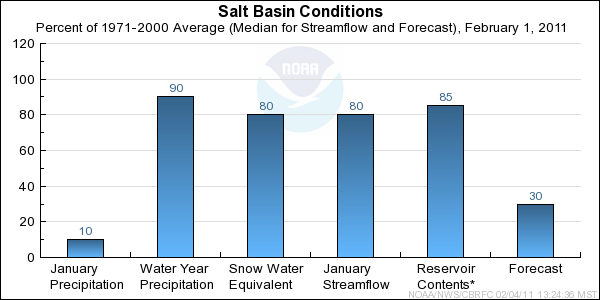
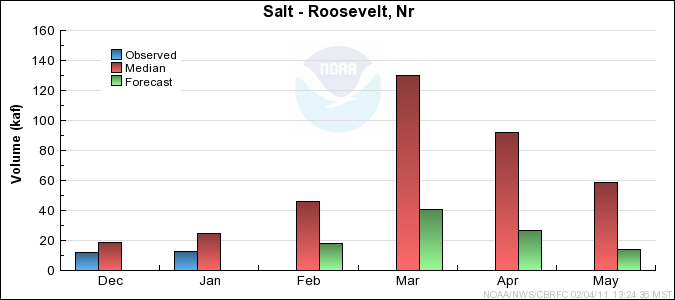
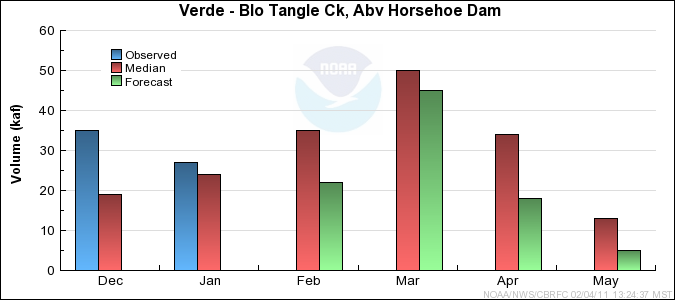
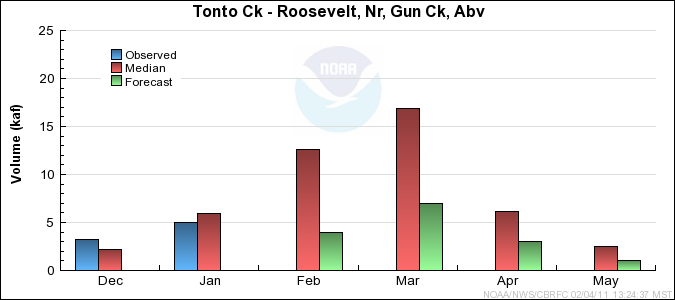
Salt Basin Conditions
The following conditions influenced this month's forecasts:
Precipitation:
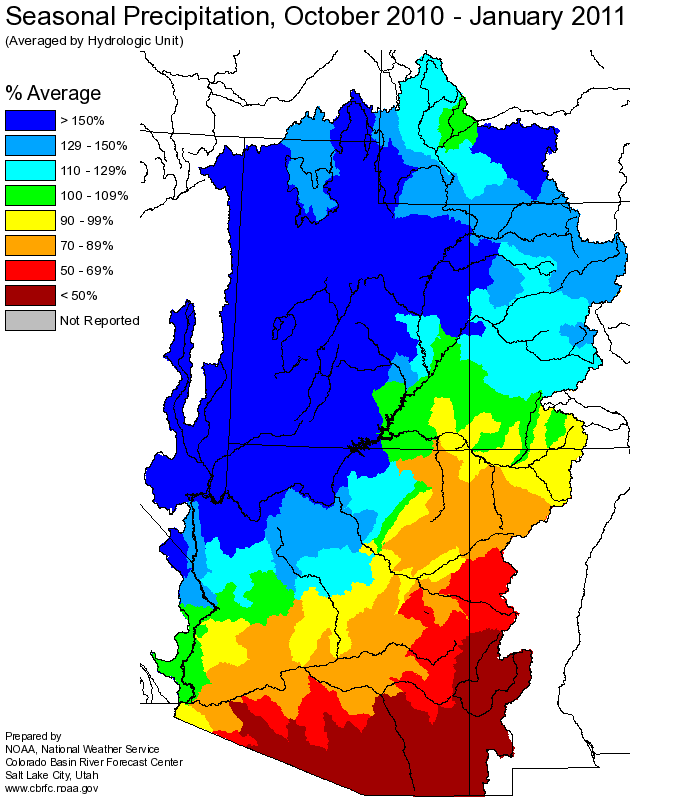
Seasonal October-January
precipitation was
near 75 percent of average in the Salt River Basin and 90 to 140 percent of average in the Verde River Basin.
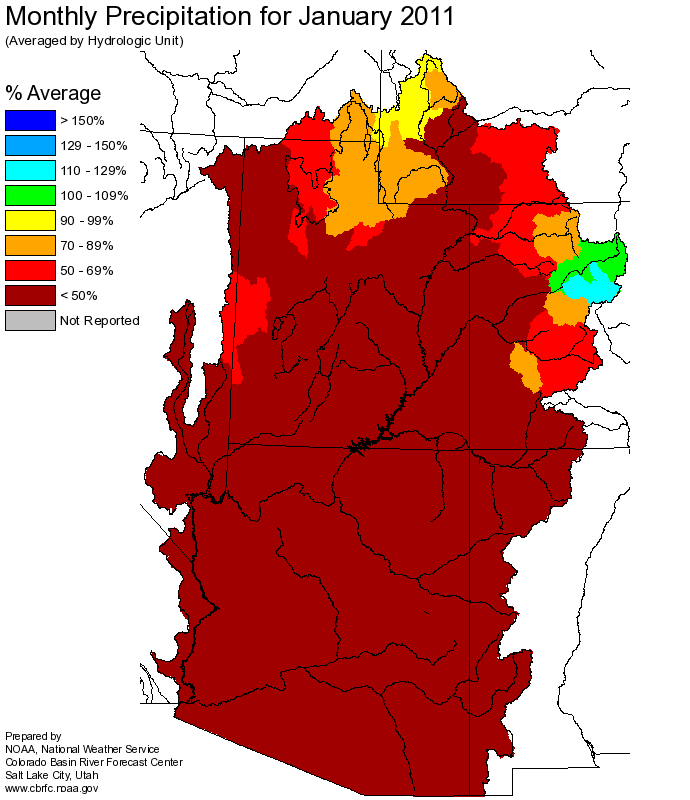
January
precipitation was 5 to 10 percent of average in the Salt and Verde River Basins.
Streamflow:
January streamflow was near 55 percent of median on the Salt River. Snow melt runoff in January resulted in
streamflow on the Verde River that was near 115% of median.
Snow:
February 1st snowpack conditions varied from 50 to 185 percent of average in the Verde River Basin, with condtions in
the upper Salt River Basin near 65 percent of average.
Salt River Basin
Snow Plot.
Verde River Basin
Snow Plot.
Soil Moisture:
Below average precipitation during the late summer and fall resulted in below average
modeled soil moisture states in the upper Salt River Basin. Wetter soil moisture
conditions exist in the Verde Basin in areas where snowpack has persisted through the
winter.
Climate Forecasts:
La Nina climate conditions suggest decreased chances for precipitation in this area.
The La Nina influence was accounted for in generation of these forecasts.
Forecast Summary:
Dry conditions in January were consistent with La Nina climate conditions that currently exist. Seasonal
precipitation October-January was generally much below average with the exception of the upper Verde Basin.
Entering the runoff season modeled soil moisture conditions were also drier in the
upper Salt River Basin in comparison to the upper Verde Basin. Snowpack conditions as
of February 1st were much below average with the exception of a couple of locations
in the upper Verde Basin.
February-May
forecast volumes are near 30 percent of median in the
Salt and Tonto Basins, and 45% of median in the Verde River Basin.
* Percent usable capacity, not percent average contents.
Click for multi-month Graph.
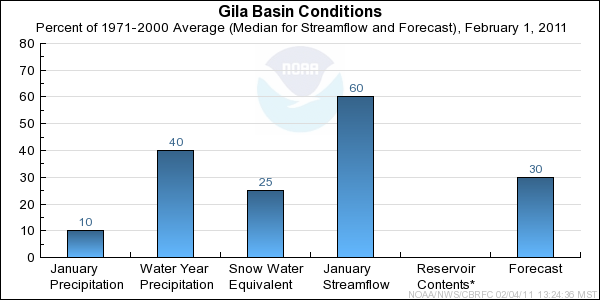
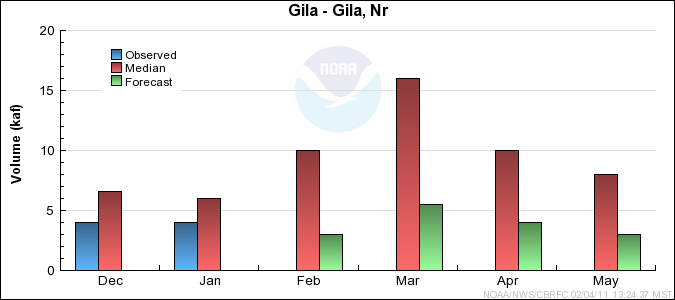
Gila Basin Conditions
The following conditions influenced this month's forecasts:
Precipitation:
Seasonal October-January
precipitation was
near 40 percent of average.
January
precipitation was near 10 percent of average.
Streamflow:
January streamflow ranged from 50 to 65 percent of median.
Snow:
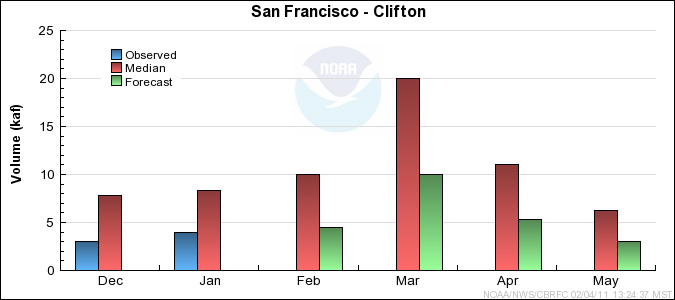
February 1st snowpack conditions were near 60 percent of average in San Francisco Basin and
25 percent of average in the upper Gila Basin.
Upper Gila Basin
Snow Plot.
San Francisco Basin
Snow Plot
Soil Moisture:
Below average precipitation has resulted in below average modeled soil moisture
states.
Climate Forecasts:
La Nina climate conditions suggest decreased chances for precipitation in this area.
The La Nina influence was accounted for in generation of these forecasts.
Forecast Summary:
Several conditions exist that support much below median Febuary-May streamflow
volumes in the Gila River Basin. These include below average seasonal precipitation and soil
moisture, and much below average snowpack. The presence of La Nina climate
conditions suggest drier than average conditions have a better chance of occuring through
the forecast period. February-May
forecast volumes range from 25 to 40
percent of median.
* Percent usable capacity, not percent average contents.
Click for multi-month Graph.
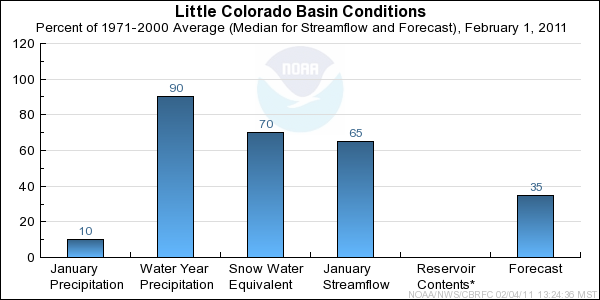
Little Colorado Basin Conditions
The following conditions influenced this month's forecasts:
Precipitation:
Seasonal October-January
precipitation ranged from near
55 percent of average in the headwater locations up to 135 percent of average near the
basin outlet.
January
precipitation ranged from 5 to 25 percent of average throughout the Little Colorado Basin.
Streamflow:
Minimal streamflow observations exist for January. The January volume on the
Little Colorado near Lyman was near 65 percent of median.
Snow:
Basin snowpack conditions on February 1st were near 70 percent of average in the southern Headwaters.
Little Colorado Southern Headwaters
Snow Plot
Central Mogollon Rim
Snow Plot
Soil Moisture:
Modeled soil moisture states varied throughout the Little Colorado. Below average
seasonal precipitation resulted in below average soil moisture conditions in the headwater locations.
Elsewhere soil moisture conditions were similar or wetter than last year entering the runoff
period.
Climate Forecasts:
La Nina climate conditions suggest decreased chances for precipitation in this area.
The La Nina influence was accounted for in generation of these forecasts.
Forecast Summary:
The presence of La Nina climate conditions suggest below average precipitation into the
spring. Below average seasonal precipitation exists over most of the Little Colorado Basin,
whith below average soil moisture conditions in the headwaters.
February-May streamflow volumes are
forecast to range from 30 to 45 percent of median.
* Percent usable capacity, not percent average contents.
Click for multi-month Graph.
Differences between the full period forecasts and the residual forecasts may not exactly equal the actual observed volumes due to rounding conventions (see Definitions section).
Monthly Streamflows

Precipitation Maps
Hydrologist: G. Smith
