Note: This publication is currently undergoing major revisions. The current publication will be replaced with a new publication based on stakeholder requirements and scientific advances. We expect to begin sharing details on this soon. If you have input on content, format, or publication frequency at any time, please contact us at cbrfc.webmasters@noaa.gov.Lake Powell Water Supply Outlook, March 1, 2011Lake Powell Water Supply Outlook, March 1, 2011
Contents
Lake Powell Sub-Basin Summaries
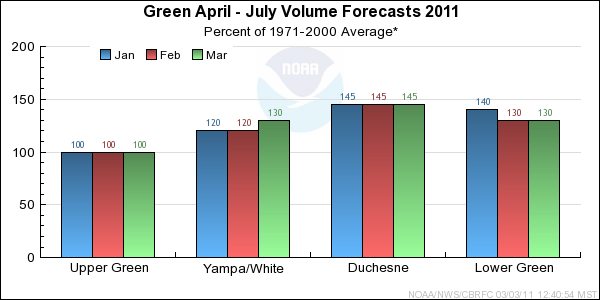
*Median of forecasts within each basin.
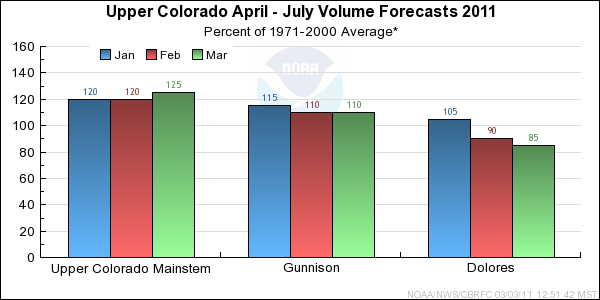
*Median of forecasts within each basin.
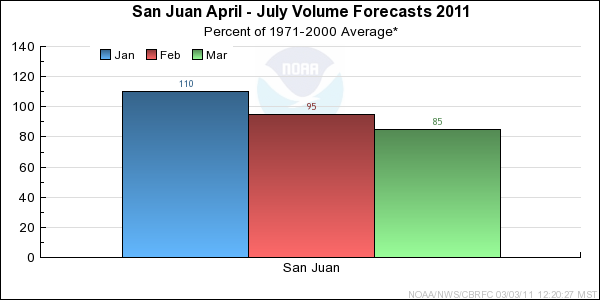
*Median of forecasts within each basin.
Upper Green Basin Conditions
The following conditions influenced this month's forecasts:
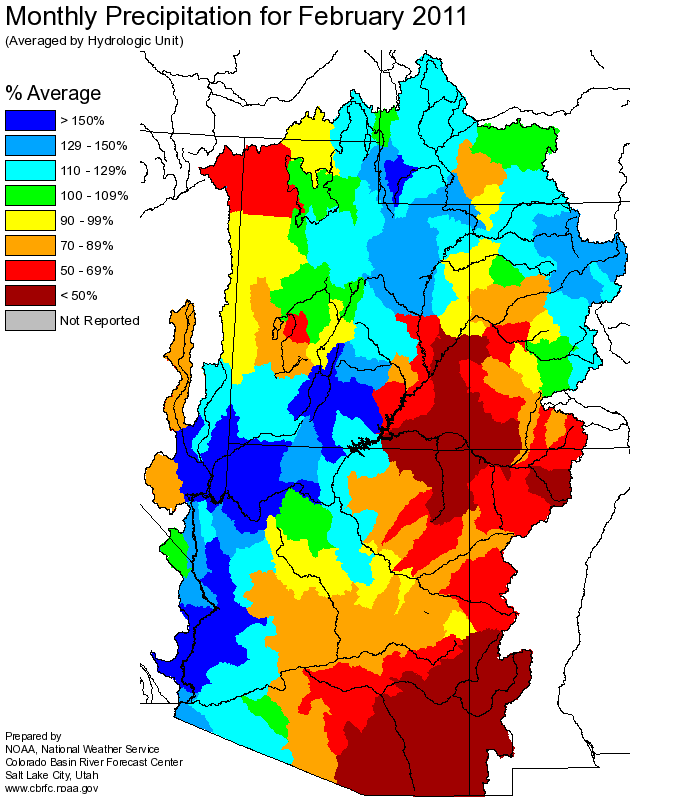
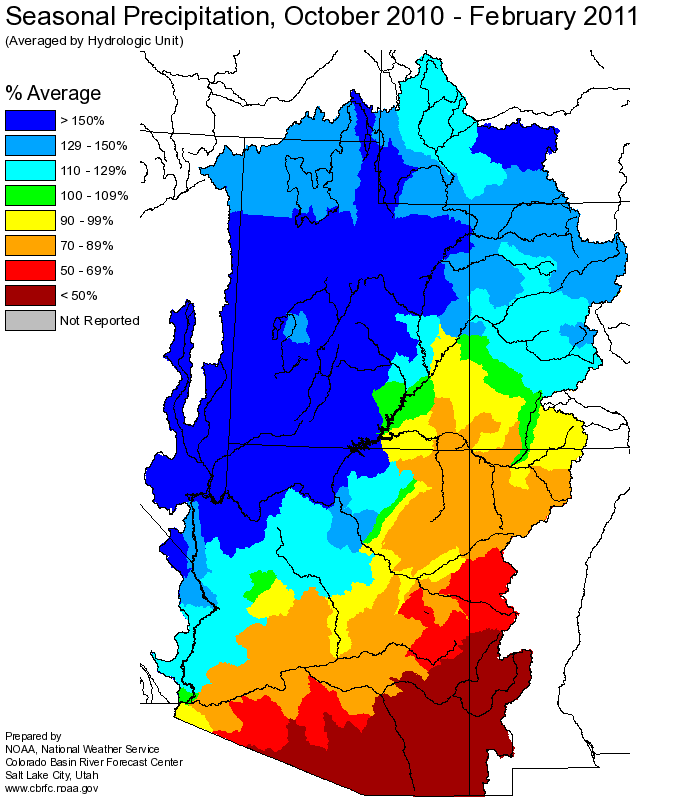
Precipitation:
Seasonal October through February
precipitation was 130 percent of average
in the Upper Green basin. February
precipitation was 115 percent of average in
the basin as a whole; however, portions of the basin such as the headwaters of the Blacks Fork River received
near 130 percent of avearge precipitation in February.
Snow:
March 1st snow water equivalent was 115 percent of average in the basin.
--- Upper Green basin
snow
water equivalent plot.
Streamflow:
February streamflow was near 80 percent of average.
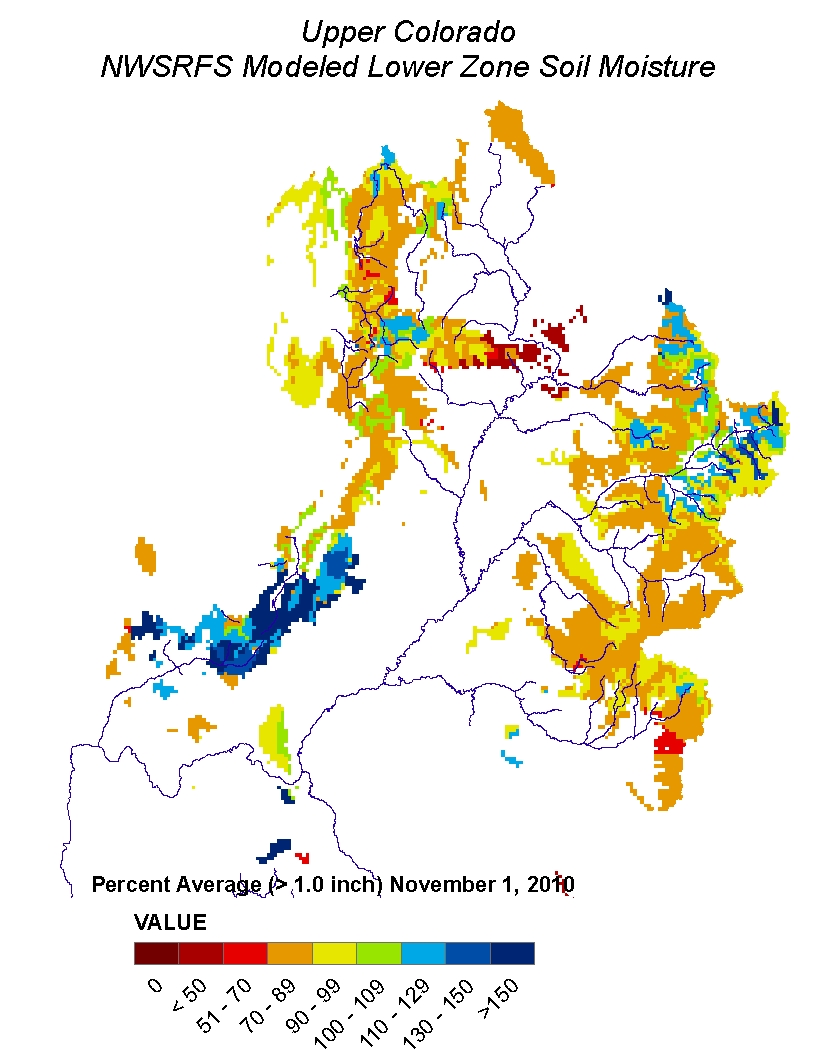
Soil Moisture:
Modeled
soil
moisture states were below average heading into the winter.
Climate Forecasts:
Climate forecasts were not a factor because there is not a strong correlation
between La Nina conditions and winter precipitation in the Upper Green basin.
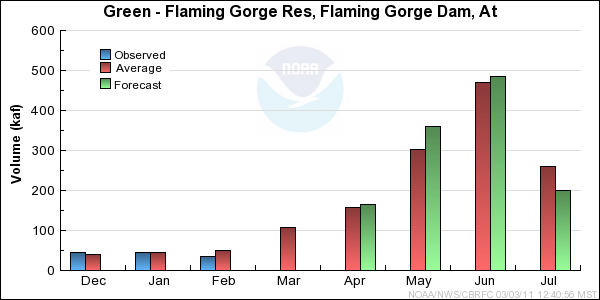
Forecast Summary:
With the addition of above average precipitation for February, the
seasonal precipitation and snow water equivalent still remain much above
average and above average, respectively. As a result of the current conditions,
the April through July streamflow volume forecasts are the same as the February
forecasts or have increased slightly. Current forecasts range between 100 and 124
percent of average with a median value of 102 percent.
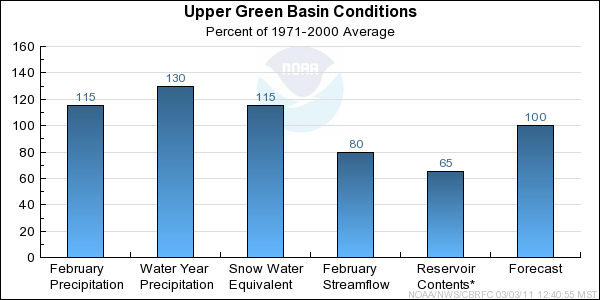
* Percent usable capacity, not percent average contents.
Click for multi-month Graph.
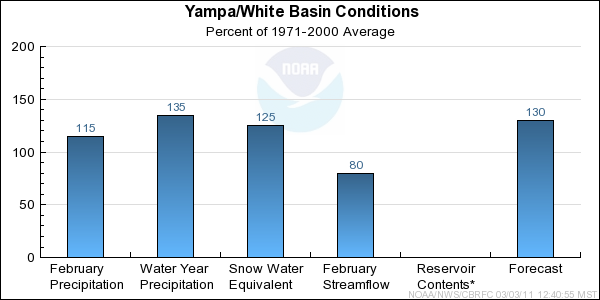
Yampa/White Basin Conditions
The following conditions influenced this month's forecasts:
Precipitation:
Seasonal October through February
precipitation was 135 percent of average
in the Yampa/White basin. February
precipitation was 115 percent of average in
the basin as a whole.
Snow:
March 1st snow water equivalent was 125 percent of average in the basin.
--- Yampa basin
snow
water equivalent plot.
Streamflow:
February streamflow was near 80 percent of average.
Soil Moisture:
Modeled
soil
moisture states were near average heading into the winter for the Yampa, Little Snake,and
White River basins.
Climate Forecasts:
Climate forecasts were not a factor in the forecasts because there is not a strong correlation
between La Nina conditions and winter precipitation in the Yampa/White basin.
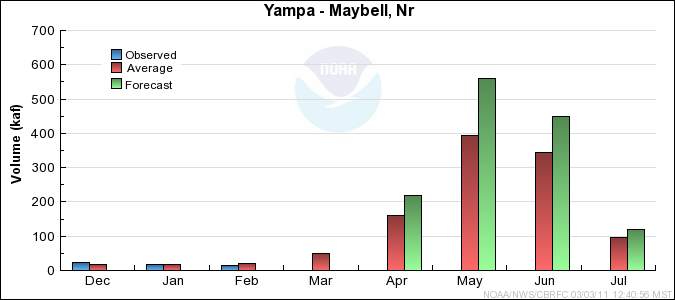
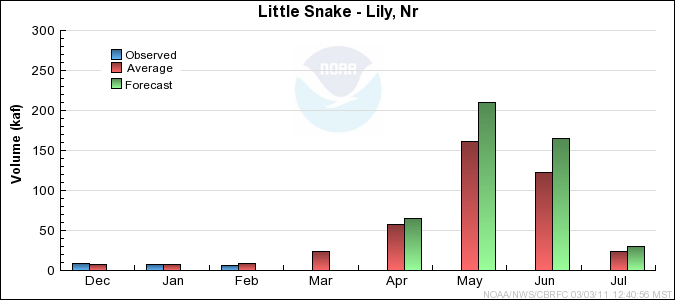
Forecast Summary:
With the addition of above average precipitation in February,
the seasonal precipitation and current snow water equivalent remain
much above average and above average, respectively.
It is also important to note that many of the snotel locations have
already surpassed the average seasonal peak. As a result of the current conditions,
the April through July streamflow volume forecasts are similar to the February
forecasts or have increased by approximately 5 to 8 percent. Current forecasts
range between 108 and 138 percent of average with a median value of 127 percent.
* Percent usable capacity, not percent average contents.
Click for multi-month Graph.
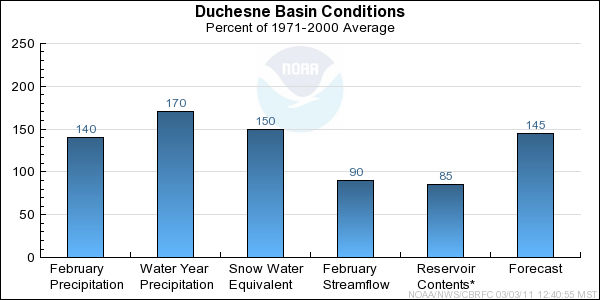
Duchesne Basin Conditions
The following conditions influenced this month's forecasts:
Precipitation:
Seasonal October through February
precipitation was 170 percent of average
in the Duchesne basin. February
precipitation was 140 percent of average.
Snow:
March 1st snow water equivalent was 150 percent of average in the basin.
--- Duchesne basin
snow
water equivalent plot.
Streamflow:
February streamflow was 90 percent of average.
Soil Moisture:
Modeled
soil
moisture states were much below average to below average heading into the winter.
Climate Forecasts:
Climate forecasts were not a factor in the forecasts because there is not a strong correlation
between La Nina conditions and winter precipitation in the Duchesne basin.
Forecast Summary:
With the addition of much above average precipitation in February,
the seasonal precipitation and current snow water equivalent remain
much above average. It is also important to note that the majority
of snotel locations in the basin have already surpassed the average
seasonal peak. As a result of the current conditions, the April through
July streamflow volume forecasts are similar to the February forecasts
or have increased by approximately 5 to 10 percent. Current forecasts
range between 115 and 182 percent of average with a median value of 145 percent.
* Percent usable capacity, not percent average contents.
Click for multi-month Graph.
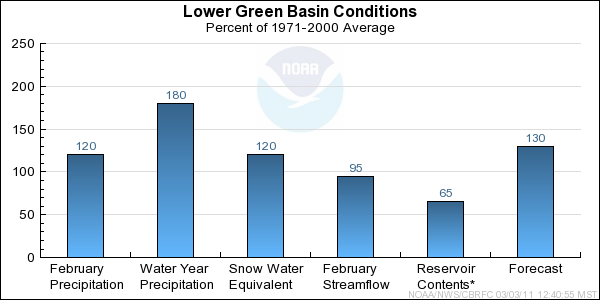
Lower Green Basin Conditions
The following conditions influenced this month's forecasts:
Precipitation:
Seasonal October through February
precipitation was 180 percent of average
in the Lower Green basin. February
precipitation was 120 percent of average.
Snow:
March 1st snow water equivalent was 120 percent of average in the basin
as a whole.
--- Lower Green basin
snow
water equivalent plot.
Streamflow:
February streamflow was near 95 percent of average.
Soil Moisture:
Modeled
soil
moisture states were much below to near average heading into the winter.
Climate Forecasts:
Climate forecasts were not a factor in the forecasts because there is not a strong correlation
between La Nina conditions and winter precipitation in the Lower Green basin.
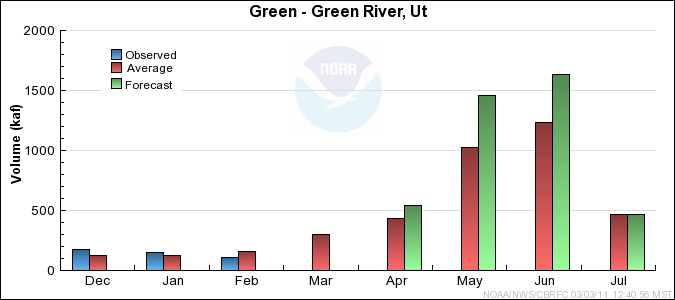
Forecast Summary:
With the addition of above average precipitation in February,
the seasonal precipitation and current snow water equivalent remain much
above average and above average, respectively. As a result of the current
conditions, the April through July streamflow volume forecasts are similar
to the February forecasts. Current forecasts range between 121 and 151 percent
of average with a median value of 129 percent.
* Percent usable capacity, not percent average contents.
Click for multi-month Graph.
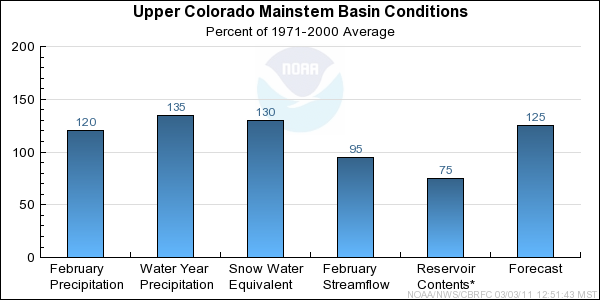
Upper Colorado Mainstem Basin Conditions
The following conditions influenced this month's forecasts:
Precipitation:
Seasonal October through February
precipitation
was near 135 percent of average in the Upper Colorado mainstem basin.
February
precipitation was near 120 percent of
average in the basin as a whole.
Snow:
March 1st snow water equivalent was near 130 percent of average in the basin
as a whole; this is near 100% of the average seasonal peak.
--- Upper Colorado basin
snow
water equivalent plot
Streamflow:
February streamflow was near 95 percent of average.
Soil Moisture:
Modeled
soil
moisture states were near to above average heading into the winter.
Climate Forecasts:
Climate forecasts were not a factor because there is not a strong correlation
between La Nina conditions and winter precipitation in the Upper Colorado mainstem basin.
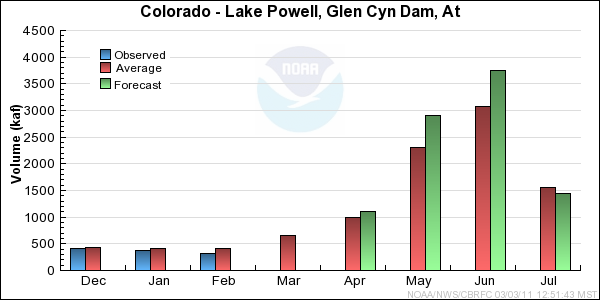
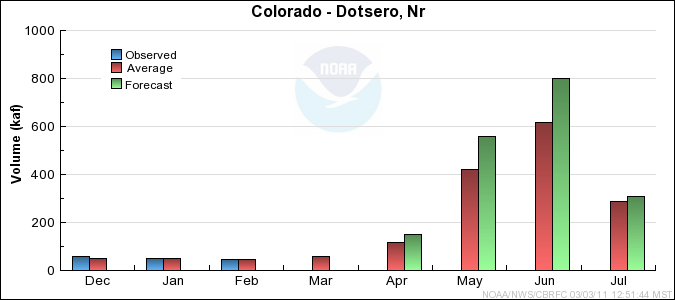
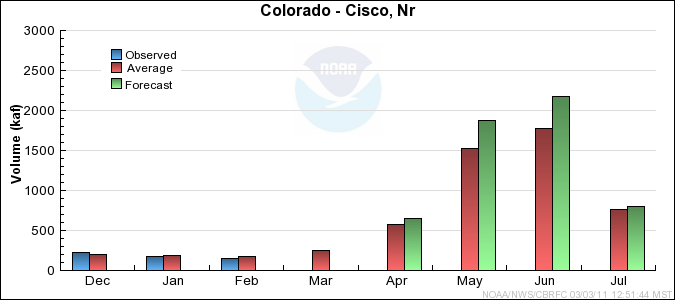
Forecast Summary:
As of March 1st the percent of average
of both the seasonal precipitation and snow water equivalent were much above average in the
basin as a whole. Almost all forecast volumes were raised from last month due to yet another
month of above average precipitation. Current April through July streamflow volume
forecasts range between 115 and 139 percent of average with a median
value of 125 percent.
* Percent usable capacity, not percent average contents.
Click for multi-month Graph.
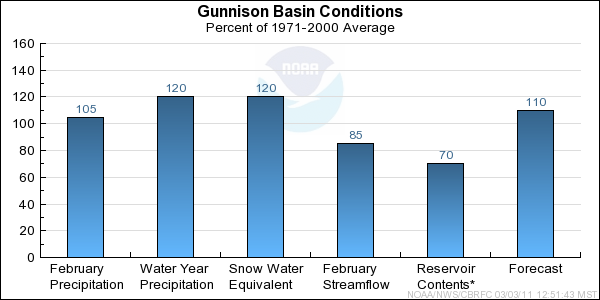
Gunnison Basin Conditions
The following conditions influenced this month's forecasts:
Precipitation:
Seasonal October through February
precipitation was 120 percent of average
in the Gunnison basin. February
precipitation was 105 percent of average.
Snow:
March 1st snow water equivalent was near 120 percent of average in the Gunnison basin; this is 95% of the seasonal peak.
--- Gunnison basin
snow
water equivalent plot
Streamflow:
February streamflow was 85 percent of average.
Soil Moisture:
Modeled
soil
moisture states were below to near average heading into the winter.
Climate Forecasts:
Climate forecasts were not a factor because there is not a strong correlation
between La Nina conditions and winter precipitation in the Gunnison basin.
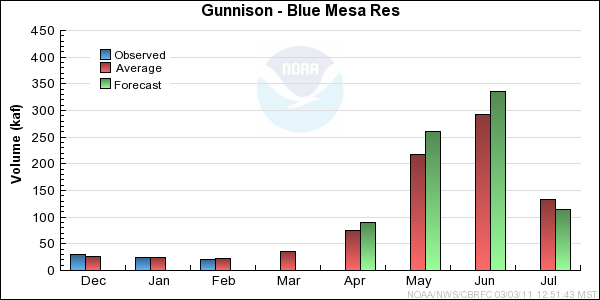
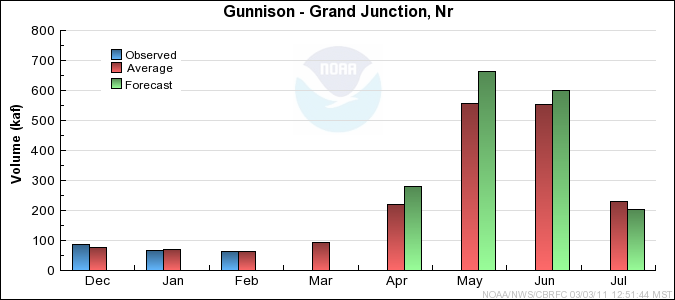
Forecast Summary:
February precipitation throughout the Gunnison basin was average at 105%. Seasonal precipitation for the Gunnison basin dropped a little from last month to 120% of average.
March 1st seasonal snow water equivalent for the Gunnison was above average with 120%; whereas the snow water equivalent is 95% of the average seasonal peak.
The percent of average for both seasonal snow water equivalent and seasonal precipitation decreased little from last month over the entire basin. Since there were slight
increases in both the seasonal snow water equivalent and seasonal precipitation in the northern portions of the Gunnison basin, the current April through July streamflow
volume forecasts remained the same from last month's forecast. Current April through July streamflow volume
forecasts range between 99 and 126 percent of average with a median value of
110 percent.
* Percent usable capacity, not percent average contents.
Click for multi-month Graph.
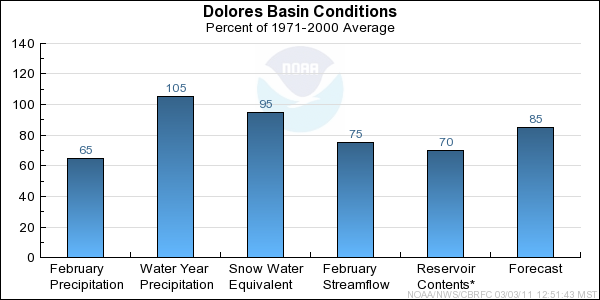
Dolores Basin Conditions
The following conditions influenced this month's forecasts:
Precipitation:
Seasonal October through February
precipitation was 105 percent of average
in the entire Dolores basin. February
precipitation was just 65 percent of average.
Snow:
March 1st snow water equivalent was 95 percent of average in the Dolores basin as a whole; this is 75% of the seasonal peak.
--- Dolores basin
snow
water equivalent plot
Streamflow:
February streamflow was 75 percent of average.
Soil Moisture:
Modeled
soil
moisture states were average to slightly below average heading into the winter.
Climate Forecasts:
The correlation of La Nina and April through July water volumes in the Dolores basin is small that
it did not influence the forecast process.
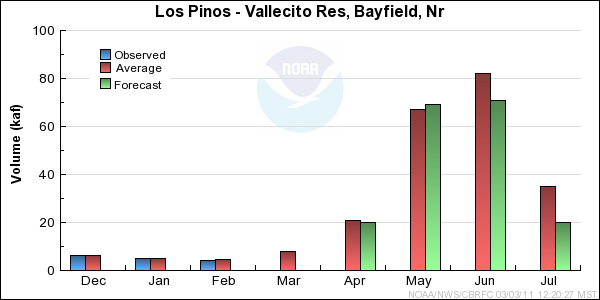
Forecast Summary:
February precipitation throughout the Dolores basin was much below average at 65%. Seasonal precipitation for the Dolores basin dropped from last month to 105% of average.
March 1st seasonal snow water equivalent for the Dolores was average with 95%; whereas the snow water equivalent is 75% of the average seasonal peak.
Since the percent of average for both seasonal snow water equivalent and seasonal precipitation decreased from last month, the current April through July streamflow volume forecasts
dropped in the Dolores Basin from last month's forecast. Current April through July streamflow volume
forecasts range between
83 and 88 percent of average, with a median value of 85 percent.
* Percent usable capacity, not percent average contents.
Click for multi-month Graph.
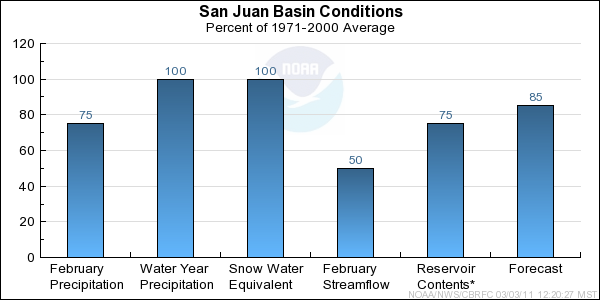
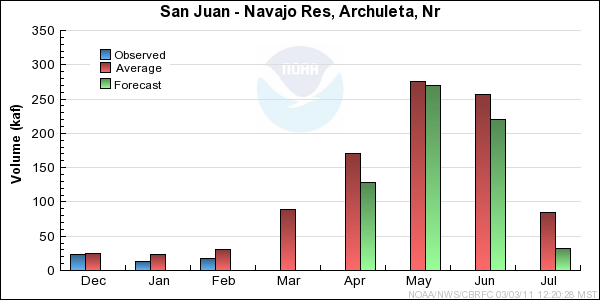
San Juan Basin Conditions
The following conditions influenced this month's forecasts:
Precipitation:
Seasonal October through February precipitation was 100 percent of average, which dropped 5 percent from February 1st.
February
precipitation was 75 percent of average, which was below average.
Snow:
Current snow water equivalent for the entire basin is 100%, which is average. The Animas basin is similar with 100%, while above Navajo
snow water equivalent was 95 percent of average. All three dropped slightly or remained the same since February 1st.
--- Animas River Basin
Snow Plot.
--- Above Navajo Basin
Snow Plot.
Streamflow:
Streamflow for the entire San Juan Basin was much below average for February at 50%. Seasonal streamflow since October
continued to be much below average at 60%, due to the much below average fall precipitation.
Soil Moisture:
Modeled
soil
moisture as of November 1st, 2010 was average to below average across the entire San Juan Basin.
Climate Forecasts:
The correlation of La Nina and April through July water volumes in the San Juan basin does suggest slightly drier than average December through May precipitation,
but it did not influence the March forecast process.
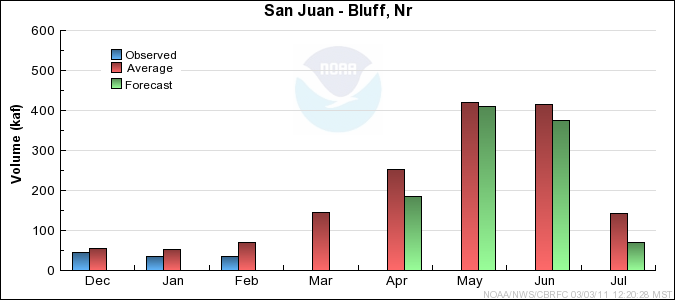
Forecast Summary:
Since February precipitation was below to much below average in the San Juan Basin, the March Water Supply April-July volume dropped 10 percent. The
April-July forecast were down compared to last month with a range from 83 to 95 percent of average. The median value of 85 percent.
* Percent usable capacity, not percent average contents.
Click for multi-month Graph.
Differences between the full period forecasts and the residual forecasts may not exactly equal the actual observed volumes due to rounding conventions (see Definitions section).
Reservoir Monthly Inflow Forecasts
Monthly Streamflows

Precipitation Maps
