New 1981-2010 Averages being used this year.
Note: This publication is currently undergoing major revisions. The current publication will be replaced with a new publication based on stakeholder requirements and scientific advances. We expect to begin sharing details on this soon. If you have input on content, format, or publication frequency at any time, please contact us at cbrfc.webmasters@noaa.gov.Upper Colorado Water Supply Outlook, March 1, 2012Upper Colorado Water Supply Outlook, March 1, 2012
Contents
Upper Colorado Summary

*Median of forecasts within each basin.
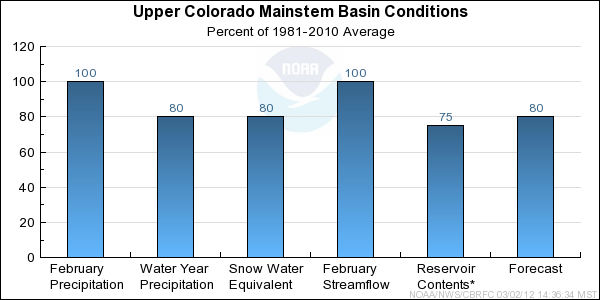
Upper Colorado Mainstem Basin Conditions
The following conditions influenced this month's forecasts:
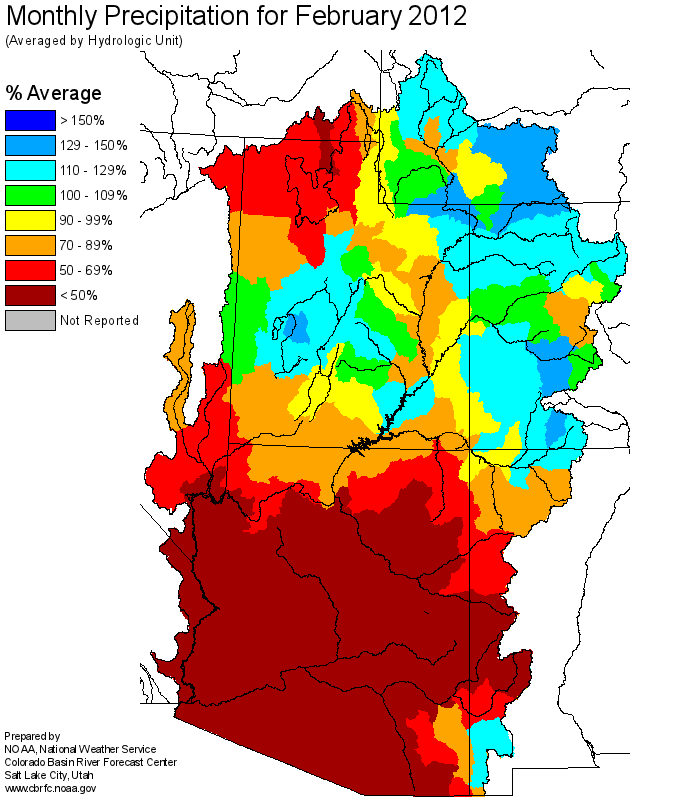
Precipitation:
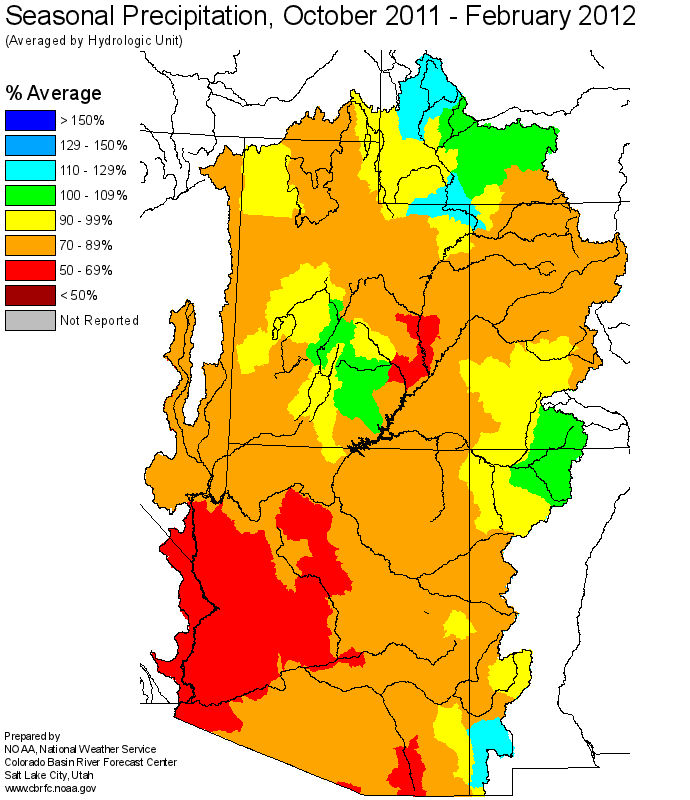
Seasonal October through February
precipitation
was near 80 percent of average in the Upper Colorado mainstem basin.
Above average precipitation occured in October but was followed by
two months of much below average precipitation in November and December.
January and February
precipitation was near normal.
Snow:
March 1st snow water equivalent was near 80 percent of average in the basin as a whole.
While it is still below average, it is an improvement from the 70 percent of average
observed on February 1st.
--- Upper Colorado basin
snow
water equivalent plot
Streamflow:
February streamflow was near 100 percent of average.
Soil Moisture:
Modeled
soil
moisture states were above average heading into the winter.
Climate Forecasts:
La Nina climate conditions exist but these do not show a strong correlation with winter
precipitation in the Upper Colorado mainstem basin, and therefore were not influential in the development
of streamflow volume forecasts.
Forecast Summary:
A wet October was followed by much below average precipitation in November and Decmeber. Near average
precipitation occurred in January and February. As of March 1st both the seasonal precipitation and
basin snow water equivalent were near 80 percent of average.
Due to a very good runoff season last year and a wet October, above average soil moisture conditions
existed in the Upper Colorado mainstem heading into the winter season.
Streamflow forecasts remained the same or increased slightly from those issued last month. The biggest
change occurred in the Wolford Mountain Reservoir inflow forecast, which went from 70 percent of average
to 83 percent of average.
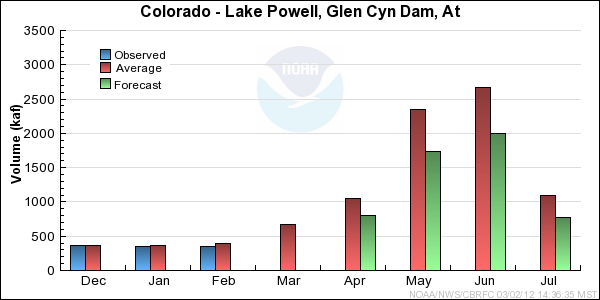
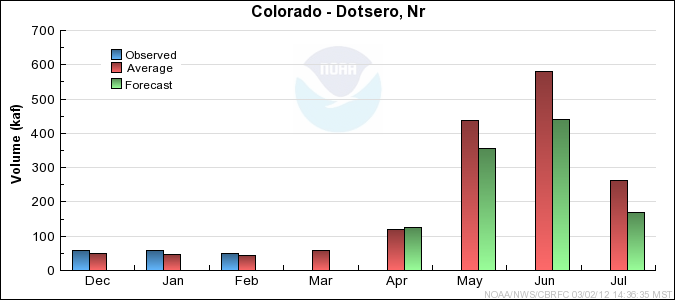
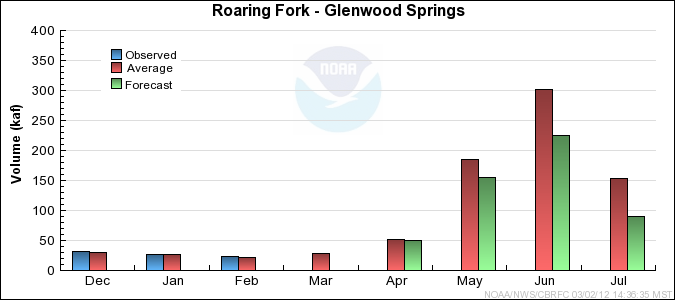
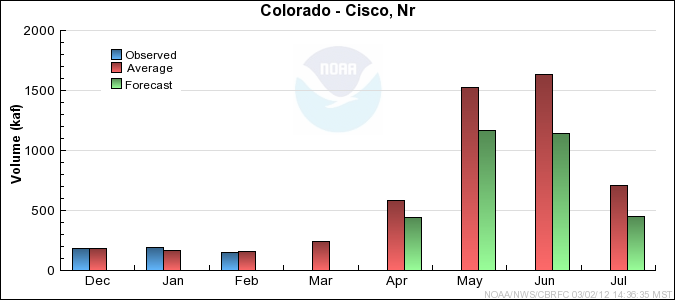
Current April through July streamflow volume
forecasts
range between 72 and 86 percent of average with a median value of 80 percent.
* Percent usable capacity, not percent average contents.
Click for multi-month Graph.
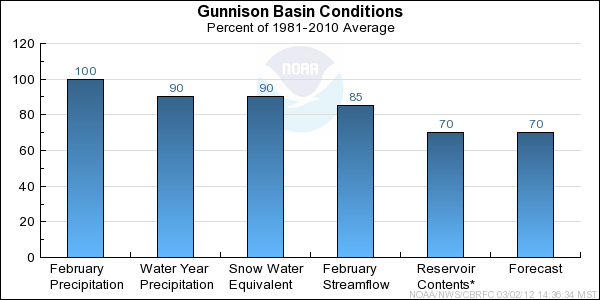
Gunnison Basin Conditions
The following conditions influenced this month's forecasts:
Precipitation:
Seasonal October through February
precipitation was 85 percent of
average in the Gunnison Basin. Above average precipitation occured in October.
Below average precipitation occurred in November and December with precipitation closer
to average in January.
February
precipitation was below average in the East River drainage,
above average in the Uncompahgre Basin and lower Gunnison, and near average elsewhere.
Snow:
March 1st snow water equivalent was 85 percent of average in the Gunnison Basin, but varied
ranging from near 65 percent of average in the northeast part of the Gunnison Basin to
near average in the southeast part of the Basin.
Gunnison Basin
snow
water equivalent plot
Streamflow:
February streamflow volumes ranged from 85 to 95 percent of average.
Soil Moisture:
Modeled
soil
moisture states were above average entering the winter season.
Climate Forecasts:
La Nina climate conditions exist but these do not show a strong correlation with winter
precipitation or Apri-July runoff volumes in the Gunnison Basin, and therefore were not
influential in the development of streamflow volume forecasts.
Forecast Summary:
A wet October was followed by drier condtions in November and Decmeber. Precipitation was near or above
average at most locations in January and February. Seasonal precipitation was near 85 percent of average
as of March 1st, with a basin snow water equivalent value near 85 percent of average. High runoff
in 2011 and a wet October resulted in above average soil moisture in the Gunnison Basin entering
the winter season. Streamflow runoff volume forecasts decreased slightly in the northeast headwaters
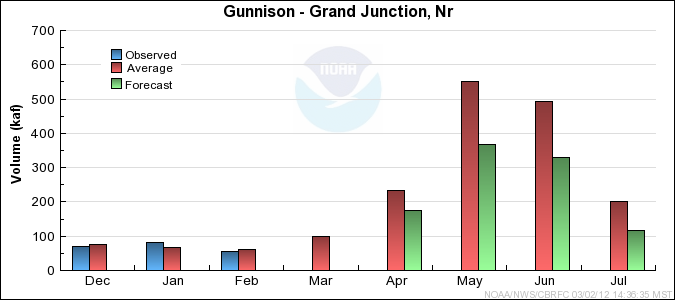
and increased slightly on some streams draining the San Juan Mountains. April-July
streamflow runoff volumes are expected to range between
60 and 90 percent of the 1981-2010 average.
* Percent usable capacity, not percent average contents.
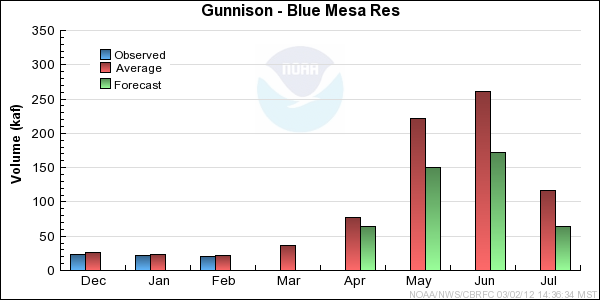
Click for multi-month Graph.
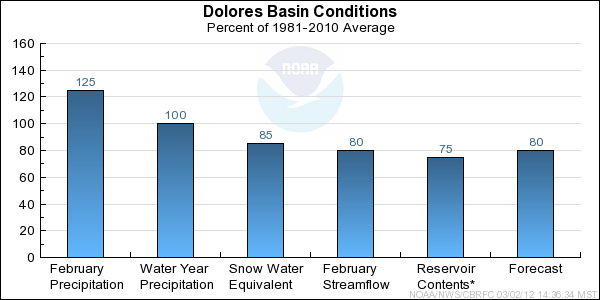
Dolores Basin Conditions
The following conditions influenced this month's forecasts:
Precipitation:
Seasonal October through February
precipitation ranged between 90 and
110 percent of average. Precipitation was above average in October, much below average in November,
and near to below average in December and January.
February
precipitation precipitation was above average throughout
the basin ranging from 110 to 140 percent of average.
Snow:
March 1st snow water equivalent was near 85 to 90 percent of average in the Dolores Basin.
Dolores Basin
snow
water equivalent plot
Streamflow:
February streamflow volumes in the Dolores River Basin were near 80 percent of average.
Soil Moisture:
Modeled
soil
moisture states were near average entering the winter season.
Climate Forecasts:
La Nina climate conditions exist but does not show a strong correlation with winter
precipitation or April-July runoff volumes in the Dolores Basin. Therefore, it was not
influential in the development of streamflow volume forecasts.
Forecast Summary:
Near average soil moisture existed in the Dolores River Basin entering the winter
season. Seasonal precipitation was near or slightly above average
on March 1st. Snow water equivalent increased from February 1st and was near 85
percent of average on March 1st. April-July
streamflow
runoff volumes are expected to range from 75 to 85 percent of the 1981-2010 average.
* Percent usable capacity, not percent average contents.
Click for multi-month Graph.
Differences between the full period forecasts and the residual forecasts may not exactly equal the actual observed volumes due to rounding conventions (see Definitions section).
Reservoir Monthly Inflow Forecasts
Monthly Streamflows
Precipitation Maps
Hydrologist: Brenda Alcorn, Greg Smith
