The following conditions influenced this month's forecasts:
Precipitation:
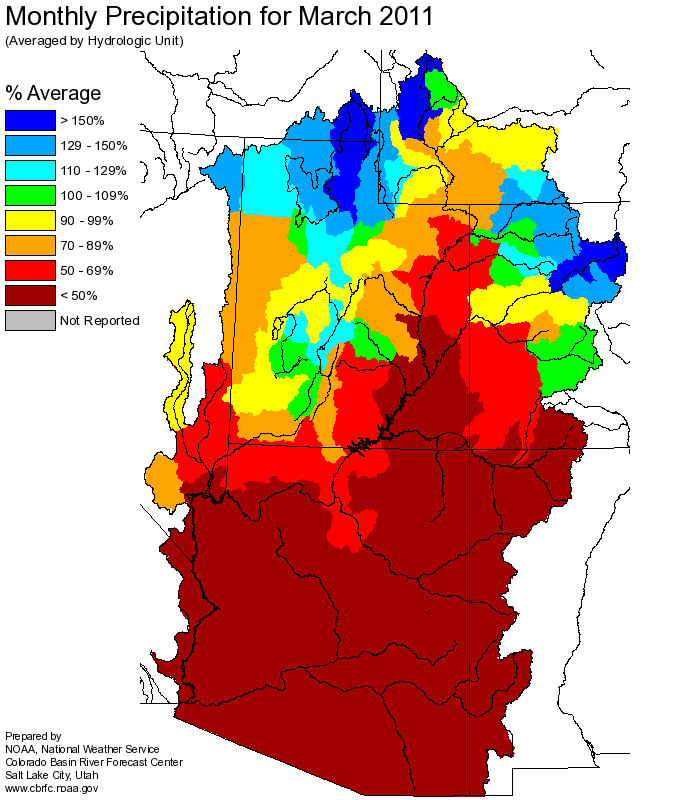
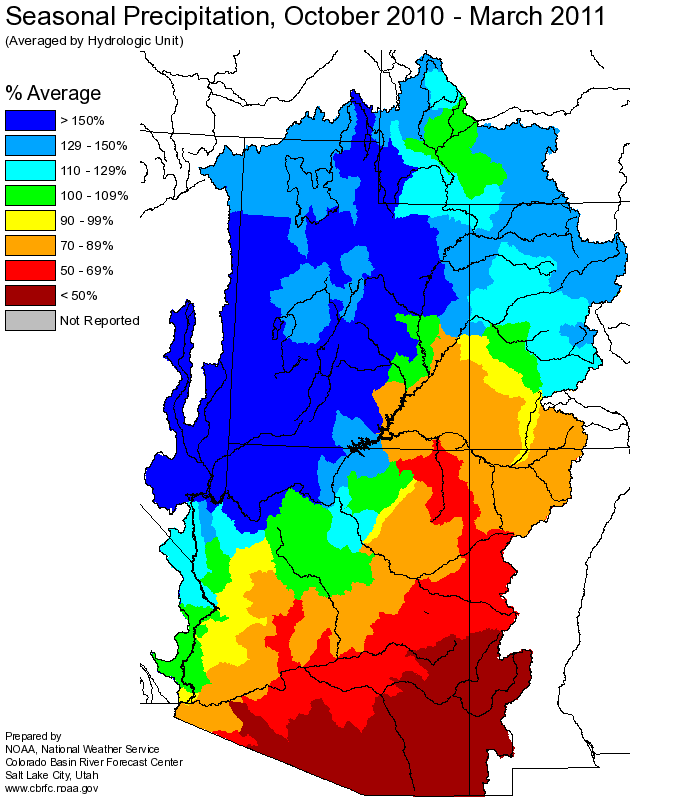
March
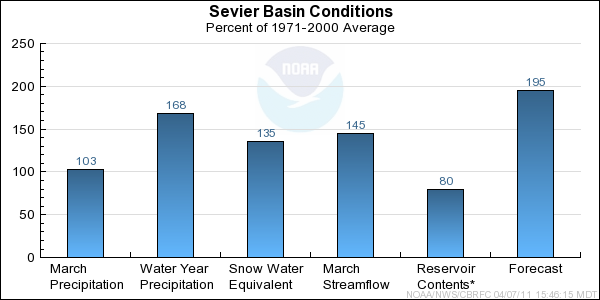
precipitation was 103 percent of average.
Seasonal October through March
precipitation was 168 percent of average.
In the upper basin the monthly precipitation was 97 percent and the seasonal precipitation was 190 percent of average.
Streamflow:
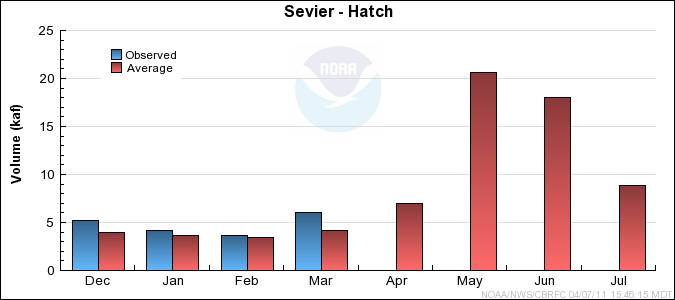
Streamflow for the Sevier River at Hatch was 147 percent of average. Many SNOTEL sites in the basin have snow water equivalent values in the top 5% of their
historical records.
Snowpack:
April 1st snow water equivalent was 135 percent of average.
---Upper Sevier River Basin
Snow Plot.
---Sevier River Basin
Snow Plot.
---Lower Sevier River Basin
Snow Plot.
Soil Moisture:
Modeled Soil
Moisture states were much above average heading into the winter.
Climate Forecasts:
Generally climate scenarios like El Nino and La Nina have a weak to moderate effect in the Sevier River Basin. However because we a lack of good
statistical correlation, these events are not specifically factored into our water supply forecasts.
Forecast Summary:
March precipitation throughout the Sevier Basin was 103 percent of average. Seasonal October through March precipitation in the Sevier Basin remained much above average at 168 percent.
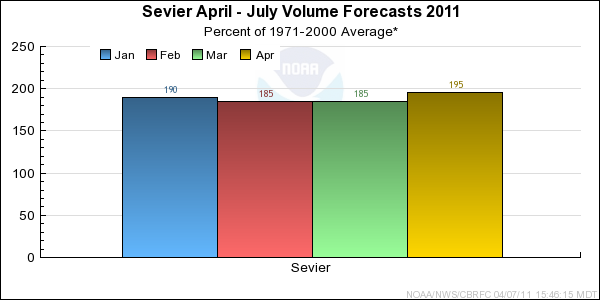
Current
April through July Seasonal volume forecast
range between 126 to 273 percent of average. The median forecast was 194 percent of average.
Many of these forecast volumes are in the top five historical observed volumes.
As a reminder, forecast for the EF Sevier, Sevier at Kingston, Piute Reservoir and Sevier near San Pitch Below Gunnison are all 'Regulated or Observed' flow forecasts rather
than 'Natural or Unregulated' forecasts which are corrected for all upstream diversions. Also because of this during large runoff years the regulated averages are exceeded in a significant
way and show fairly large numbers. The Sevier at Kingston is a case in point for 2011.
Differences between the full period forecasts and the residual forecasts may not exactly equal the actual observed volumes due to rounding conventions (see Definitions section).