Note: This publication is currently undergoing major revisions. The current publication will be replaced with a new publication based on stakeholder requirements and scientific advances. We expect to begin sharing details on this soon. If you have input on content, format, or publication frequency at any time, please contact us at cbrfc.webmasters@noaa.gov.Great Basin Water Supply Outlook, June 1, 2011Great Basin Water Supply Outlook, June 1, 2011
Contents
Great Basin Summary
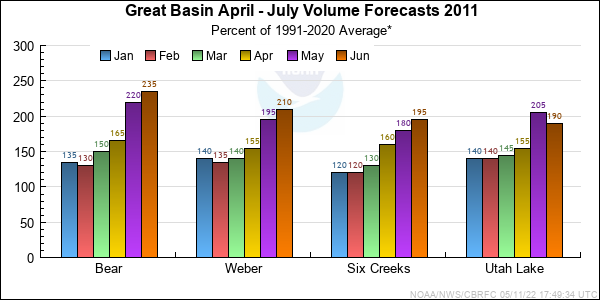
*Median of forecasts within each basin.
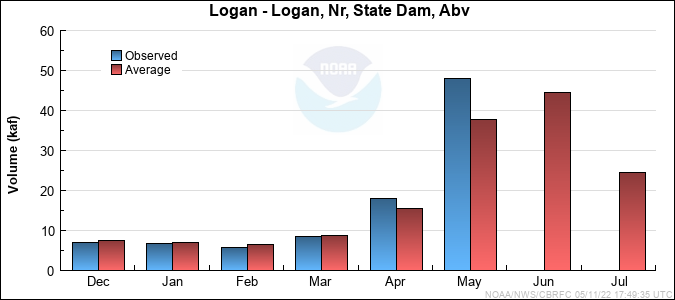
Bear Basin Conditions
Many of these forecast volumes are in the top five historical observed volumes.
The following conditions influenced this month's forecasts:
Precipitation:
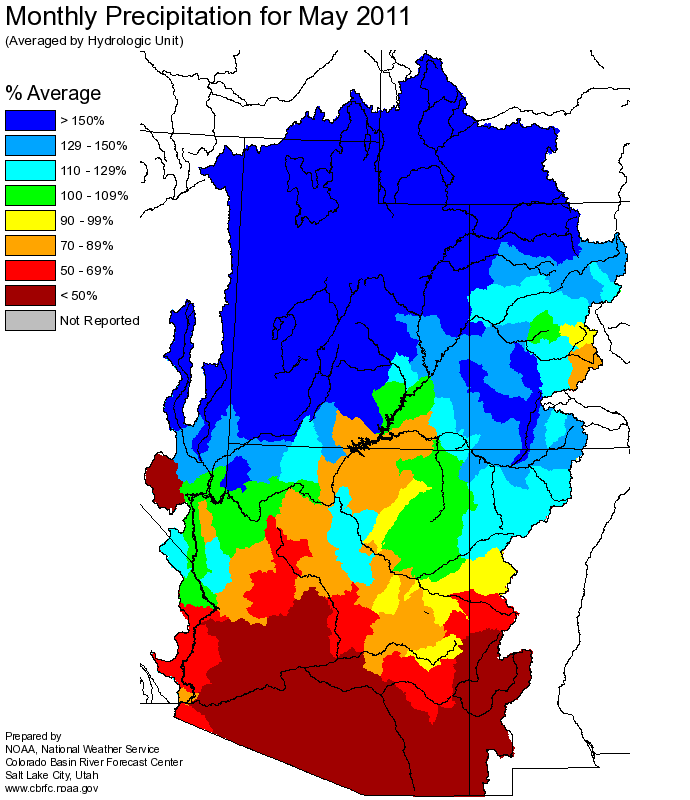
May
precipitation was 173 percent of average.
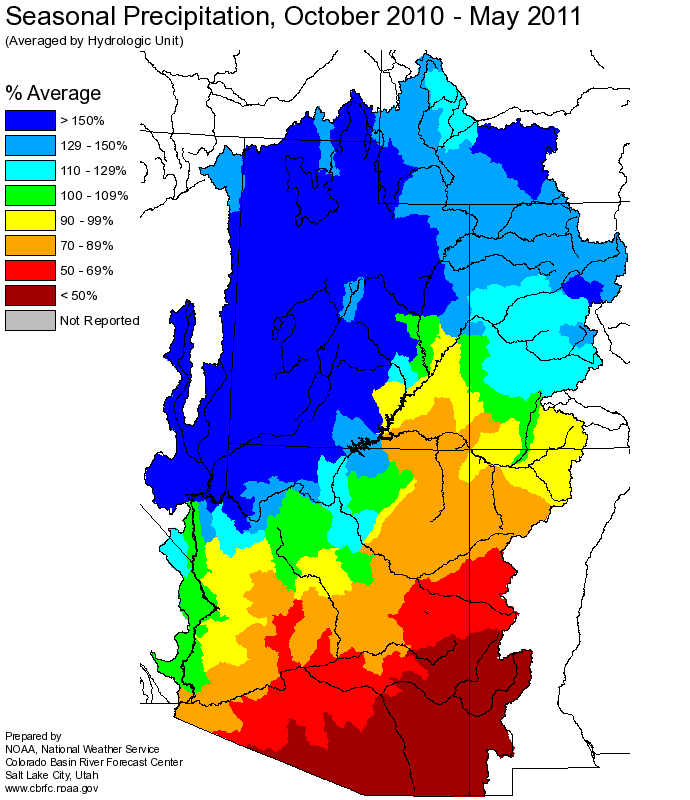
Seasonal, October through April
precipitation was 155 percent of average.
Streamflow:
May streamflow for the Logan River nr Logan was 126 percent of average. Woodruff Narrows inflow on the Bear River was 141 percent of average.
Snowpack:
June 1st snow water equivalent was 489 percent of the daily average. Please note that this time of year the percent of average my not provide a valid measure of conditions.
Another month of cooler than average temperatures has delayed the bulk of the snow melt and as of June 1st their was still 112 percent of the average peak snow.Many SNOTEL
sites throughout the basin have snow water equivalent values that are at record levels when compared to their historical period (20-30 years)
---Upper Bear River Basin
Snow Plot.
---Bear River Below Woodruff Narrows Reservoir
Snow Plot.
---Bear River Basin
Snow Plot.
Soil Moisture:
Modeled Soil
Moisture states were near average to above average for the northern Uinta Mountains heading into the winter.
Climate Forecasts:
Climate forecasts were not factored into the northern Utah forecasts because there is not a strong statistical correlation between
El Nino/La Nina conditions and winter precipitation.
Forecast Summary:
Cooler than average temperatures during May and much above average precipitation for a third consecutive month have combined to create record snow pack conditions as of June 1st.
Current
April through July seasonal volume forecasts remain much above average
and range between 162 and 265 percent of average with a median value of 236 percent.
Many of these forecast volumes are in the top five historical observed volumes.
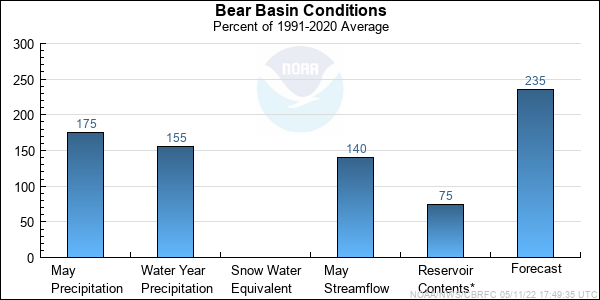
* Percent usable capacity, not percent average contents.
Click for multi-month Graph.
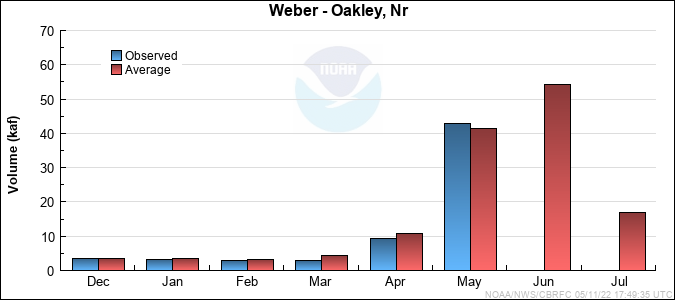
Weber Basin Conditions
Many of these forecast volumes are in the top five historical observed volumes.
The following conditions influenced this month's forecasts:
Precipitation:
May
precipitation was 185 percent of average.
Seasonal October through April
precipitation was 160 percent of
average.
Streamflow:
Streamflow above Rockport Reservoir last month was 124 percent of average.
Snowpack:
June 1st snow water equivalent was 513 percent of the daily average. As a percentage for the average seasonal peak snow (average max) the value was approximately 100 percent of average. This value usually occurs in
early April. Many SNOTEL sites in the basin have snow water equivalent values in the top 5% of their
historical daily records. * Analysis based on average may not provide a valid measure of conditions.
---Weber River Basin
Snow Plot.
---Upper Weber River Basin
Snow Plot.
Soil Moisture:
Modeled Soil
Moisture states were mostly above normal in the western Uinta Mountains near the headwaters of the Weber heading into winter.
Climate Forecasts:
Climate forecasts were not factored into the northern Utah forecasts because there is not a strong correlation between
El Nino conditions and winter precipitation.
Forecast Summary:
Cooler than average temperatures during May and much above average precipitation for a third consecutive month have combined to create record snow pack conditions as of June 1st.
Current
April through July seasonal volume
forecasts remain much above average, and range between 138 and 258 percent of average with a median value of 208 percent.
Many of these forecast volumes are in the top five historical observed volumes.
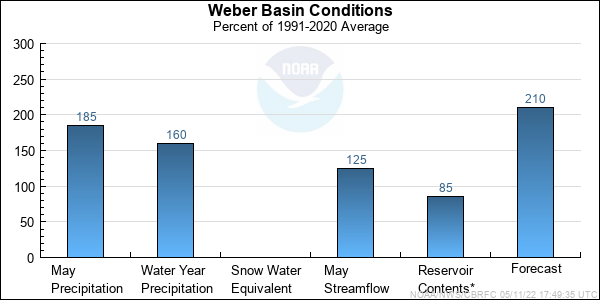
* Percent usable capacity, not percent average contents.
Click for multi-month Graph.
Six Creeks Basin Conditions
The following conditions influenced this month's forecasts:
Precipitation:
May
precipitation was 230 percent of average.
Seasonal October through April
precipitation was 168 percent
of average.
Streamflow:
Streamflows for Emigration Creek near Salt Lake City last month were 190 percent of average.
Snowpack:
June 1st snow water equivalent was 313 percent of the daily average. As a percentage of the average seasonal peak snow (average max) the value was 150 percent of average. This value usually occurs in early April. Many SNOTEL sites in the basin have snow water equivalent values in the top 5% of their
historical daily records, with a few at record levels. * Analysis based on average may not provide a valid measure of conditions.
---Six Creeks River Basin
Snow Plot.
---Big and Little Cottonwood Canyons
Snow Plot.
Soil Moisture:
Modeled Soil
Moisture states were near average in the Six Creeks Basin heading into winter.
Climate Forecasts:
Climate forecasts were not factored into the northern Utah forecasts because there is not a strong correlation between
El Nino conditions and winter precipitation.
Forecast Summary:
Cooler than average temperatures during May and much above average precipitation for a third consecutive month have combined to create record snow pack conditions as of June 1st.
Current
April through July seasonal volume forecasts remain much above average,
and range between 150 and 256 percent of average with a median value of 196 percent of average.
Many of these forecast volumes are in the top five historical observed volumes.
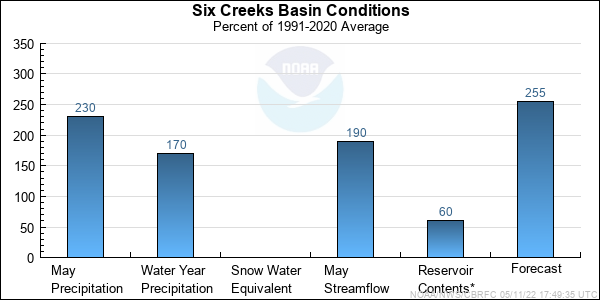
* Percent usable capacity, not percent average contents.
Click for multi-month Graph.
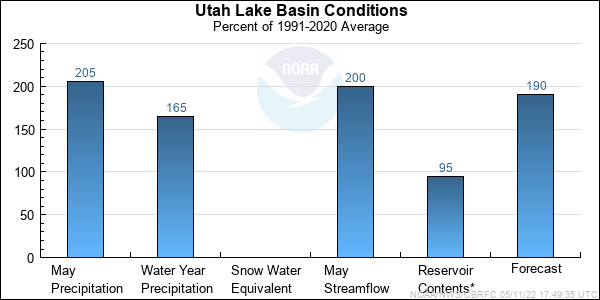
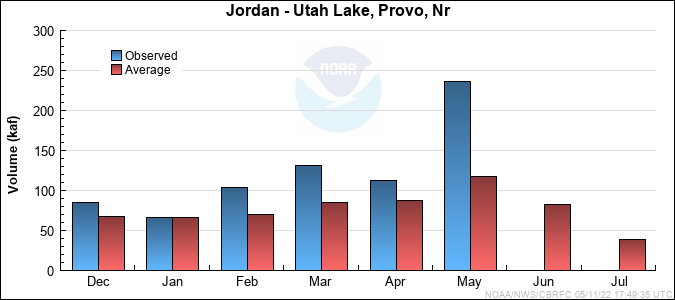
Utah Lake Basin Conditions
Many of these forecast volumes are in the top five historical observed volumes.
The following conditions influenced this month's forecasts:
Precipitation:
May
precipitation was 205 percent of average.
Seasonal October through April
precipitation is 164 percent of average.
Streamflow:
Streamflow for the Provo at Hailstone last month was 108 percent of average. Unregulated inflows into Utah Lake
were 201 percent of average.
Snowpack:
June 1st snow water equivalent was 568 percent of the daily average. As a percentage of the average seasonal peak snow (average max) the value was 60 percent of average. This value usually occurs in early May. Many SNOTEL sites in this basin have snow water equivalent values in the top 5% of their
historical records, with a few at record levels. * Analysis based on average may not provide a valid measure of conditions.
---Provo River, Utah Lake Basin
Snow Plot.
Soil Moisture:
Modeled Soil
Moisture states were average to above average heading into the winter.
Climate Forecasts:
Climate forecasts were not factored into the northern Utah forecasts because there is not a strong correlation between
El Nino conditions and winter precipitation here.
Forecast Summary:
Cooler than average temperatures during May and much above average precipitation have combined to hold our large snowpack much longer than normal as of June 1st. In this drainage melt is ahead
of it's northern basin neighbors with melt proceeding faster than the Weber, Ogden and Bear Basins.
April through July seasonal volume forecasts remain much above average
and range between 162 and 257 percent of average with a median value of 188 percent.
Many of these forecast volumes are in the top five historical observed volumes.
* Percent usable capacity, not percent average contents.
Click for multi-month Graph.
Differences between the full period forecasts and the residual forecasts may not exactly equal the actual observed volumes due to rounding conventions (see Definitions section).
Monthly Streamflows

Precipitation Maps
Hydrologist: B.Bernard
