Note: This publication is currently undergoing major revisions. The current publication will be replaced with a new publication based on stakeholder requirements and scientific advances. We expect to begin sharing details on this soon. If you have input on content, format, or publication frequency at any time, please contact us at cbrfc.webmasters@noaa.gov.Virgin Water Supply Outlook, June 1, 2009Virgin Water Supply Outlook, June 1, 2009
Contents
Virgin Summary
Model Soil Moisture/Observed Streamflow - Streamflow in the upper Virgin and Santa Clara
Rivers during May ranged from near 60 to 80 percent of average (115 to 130 percent of median),
as a result of snow melt runoff. Below average soil moisture conditions existed in the Virgin
River Basin heading into the winter season.
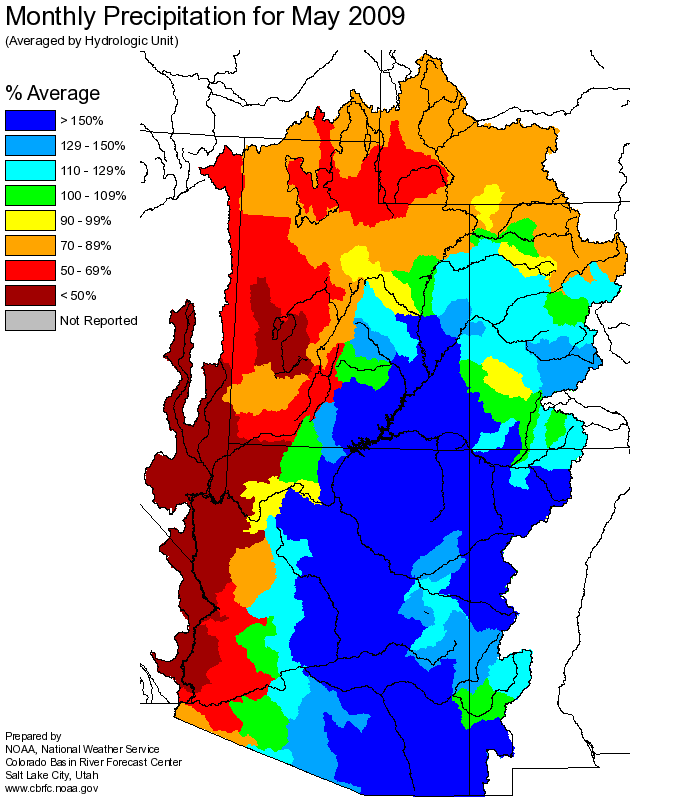
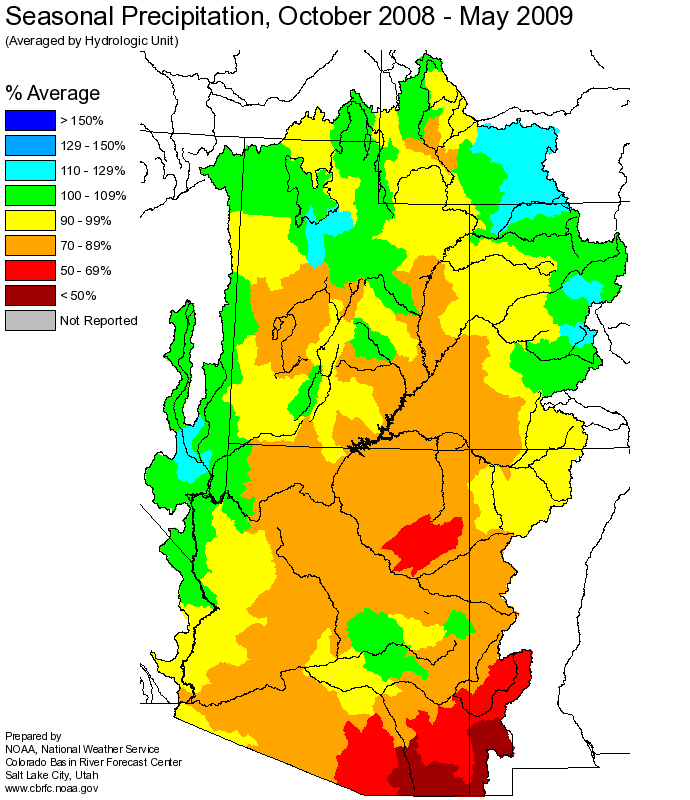
Snowpack/Precipitation - The snowpack peaked above average in the upper Virgin River basin
this spring. Precipitation in the upper Virgin River Basin was below average in May. Seasonal
precipitation for October through May ranged from near 90 to 110 percent of average.
General Discussion/Forecasts - June through July runoff volumes are expected to range from
40 to 70 percent of average, which equates to 65 to 115 percent of the 1971-2000 median values.
Forecast runoff is near median in the headwater locations, with lesser volumes further downstream,
below the diversions.

*Median of forecasts within each basin.
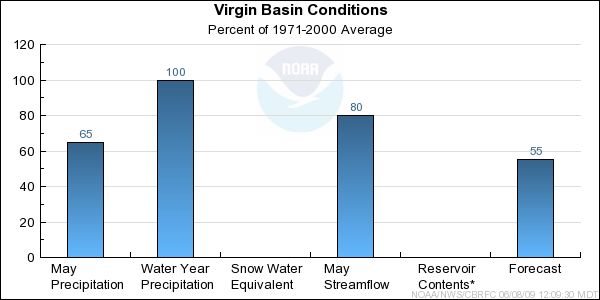
Virgin Basin Conditions
June-July runoff volumes in the Virgin River Basin are expected to range from near 40 to 70 percent
of the average (65 to 115 percent of median). Volumes closer to the long term median are expected
in the headwater locations, with lesser amounts below diversions. Seasonal April-July volumes are expected
to range from 40 to 65 percent of average (70 to 110 percent of median).
* Percent usable capacity, not percent average contents.
Click for multi-month Graph.
Differences between the full period forecasts and the residual forecasts may not exactly equal the actual observed volumes due to rounding conventions (see Definitions section).
Precipitation Maps
Hydrologist: G. Smith
