Note: This publication is currently undergoing major revisions. The current publication will be replaced with a new publication based on stakeholder requirements and scientific advances. We expect to begin sharing details on this soon. If you have input on content, format, or publication frequency at any time, please contact us at cbrfc.webmasters@noaa.gov.Green Water Supply Outlook, January 1, 2009Green Water Supply Outlook, January 1, 2009
Contents
Green Summary
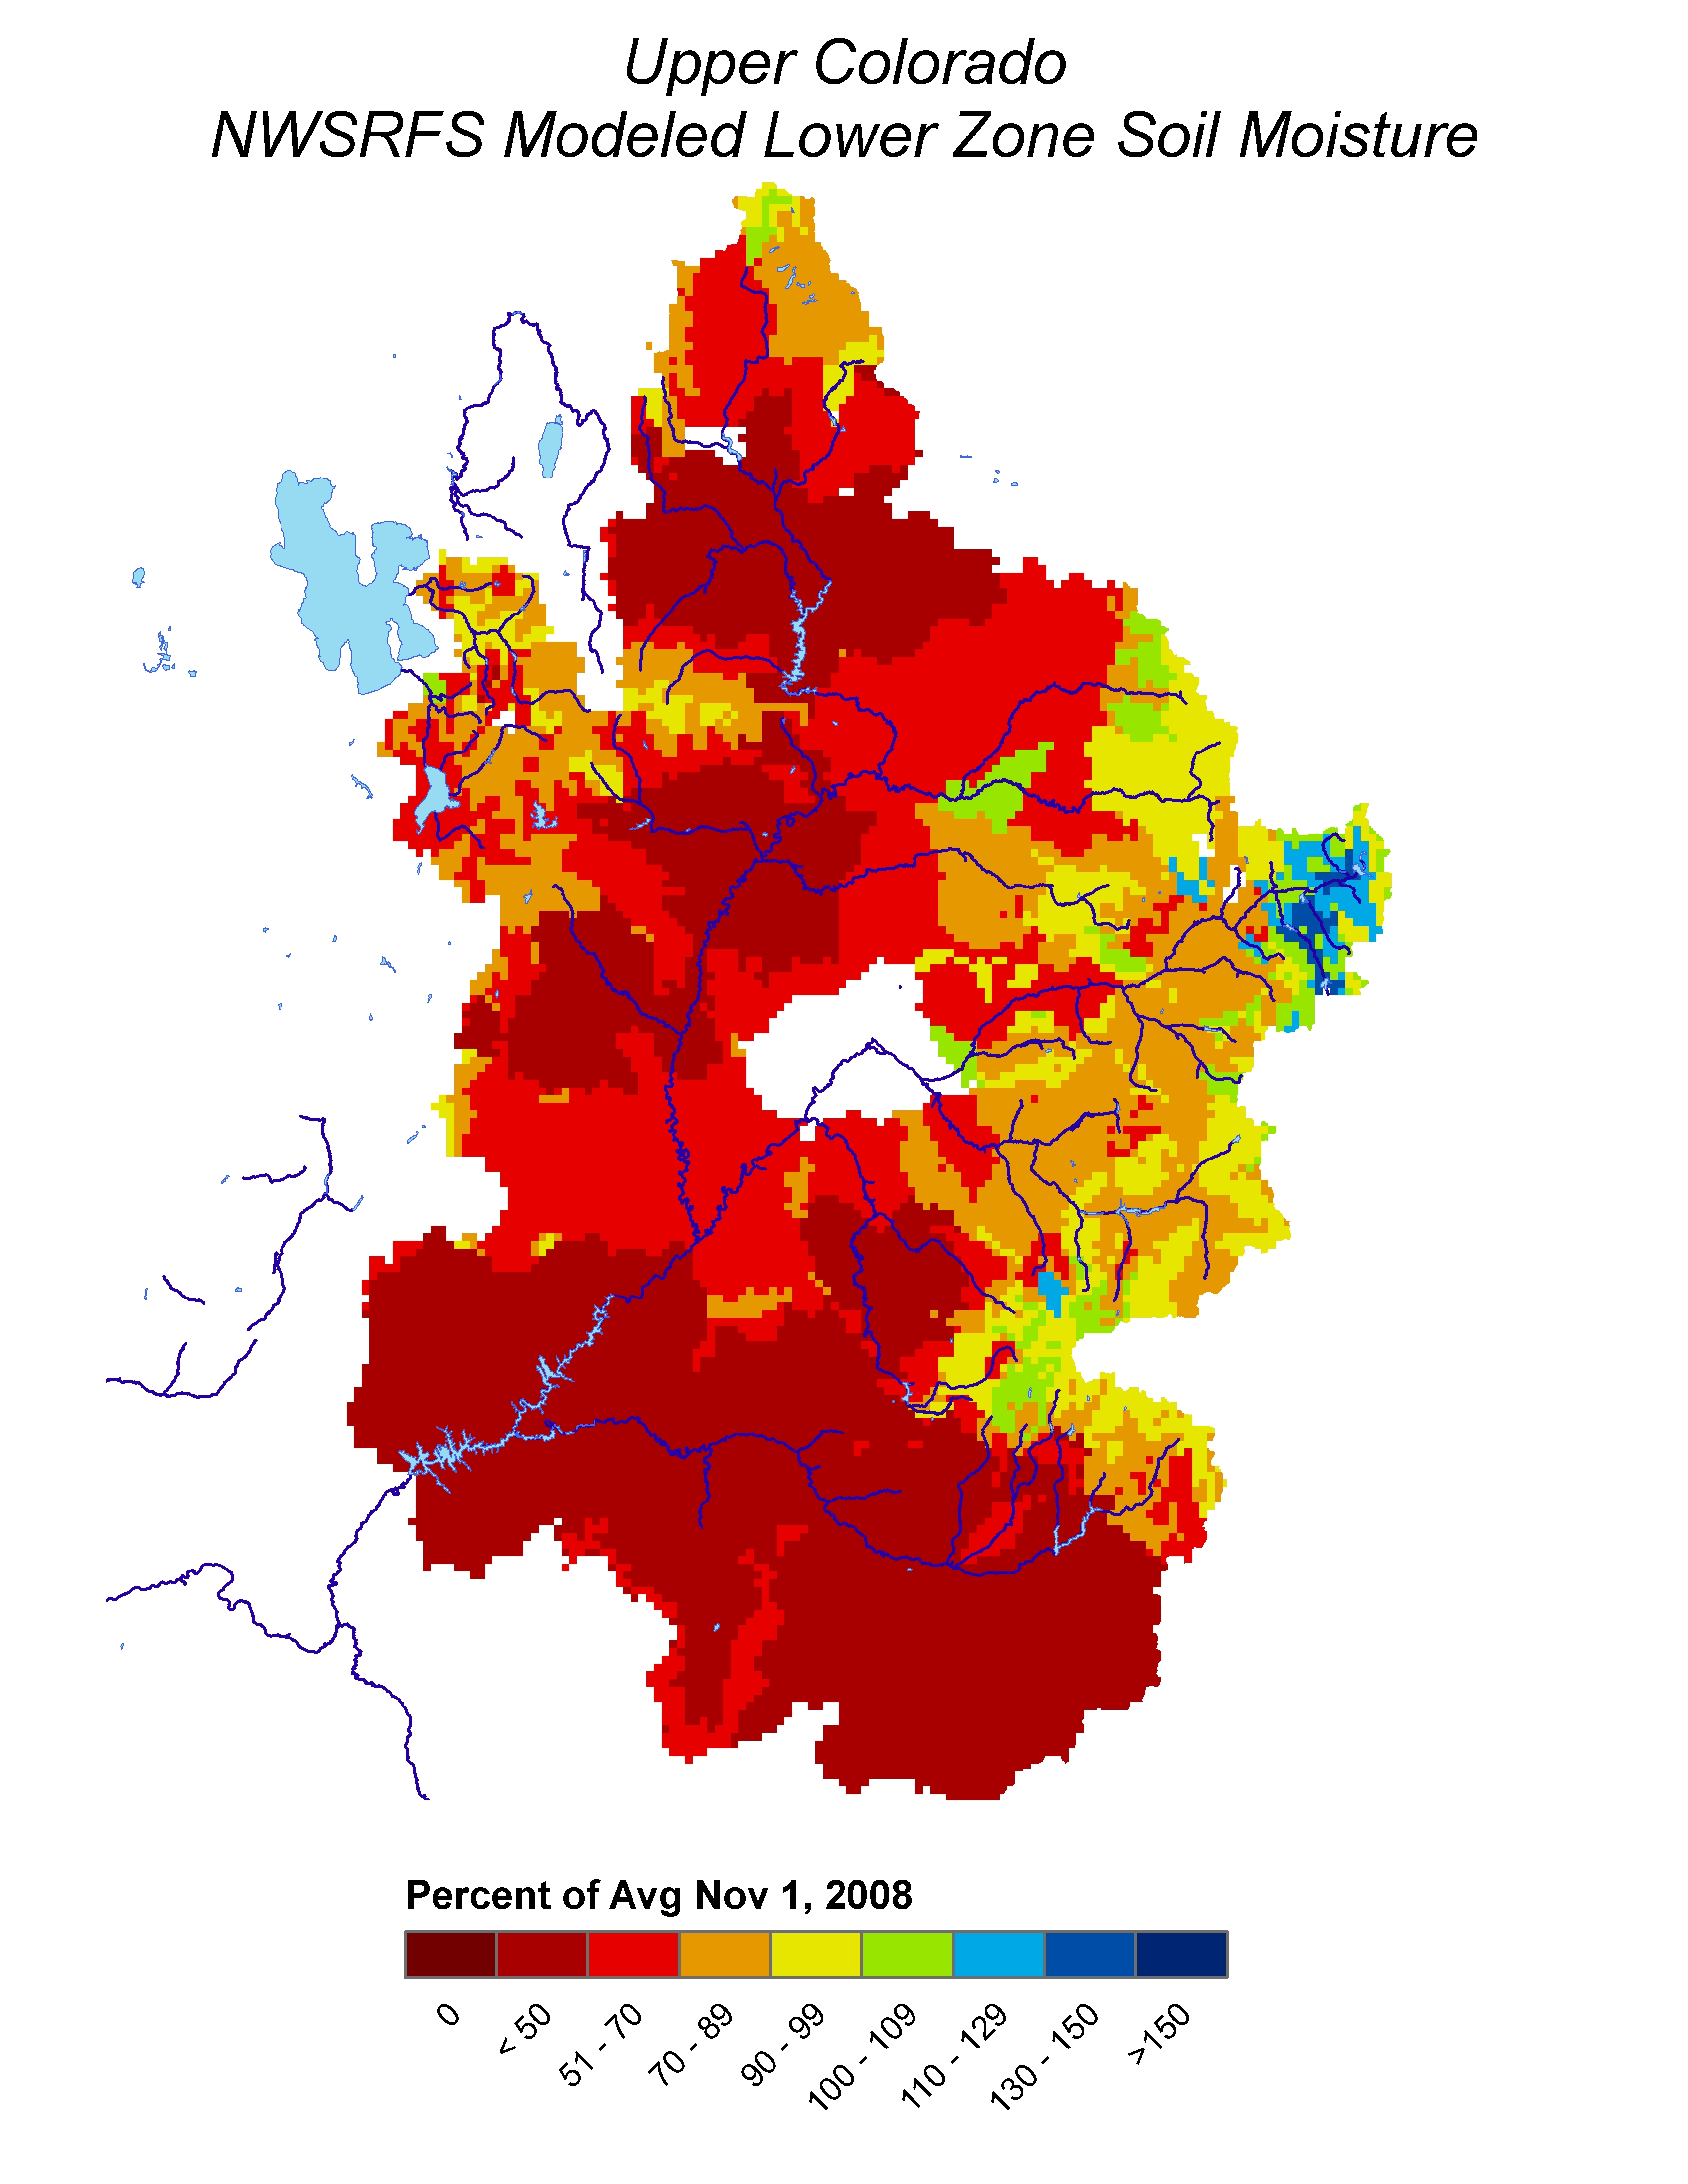
Modeled soil moisture continues to indicate much below and below average conditions for most of Green River Basin.
(Click for November 1st image) This signal is
incorporated in the
ESP model guidance utilized by the CBRFC in generating our forecasts. At the time of this publication,
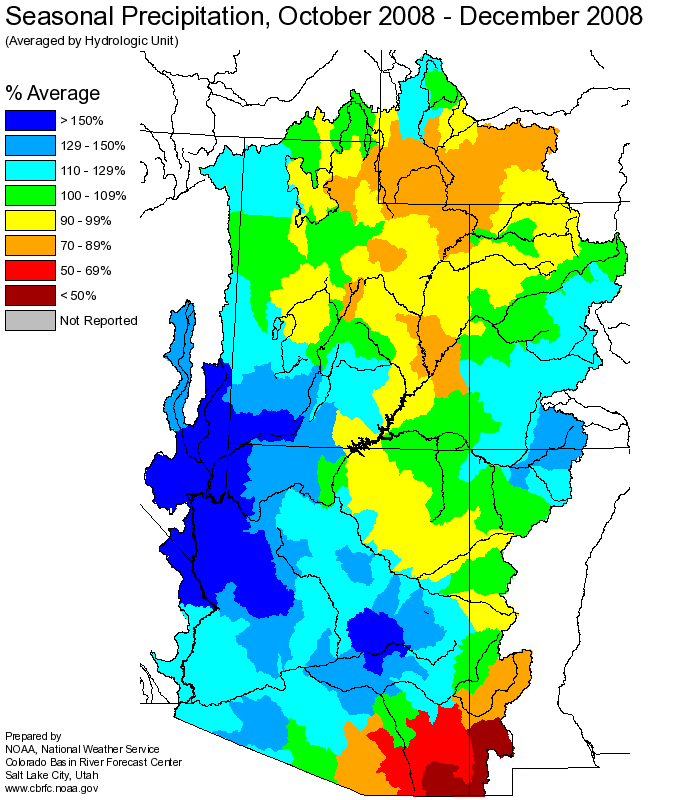
seasonal precipitation is near normal for most of the region. Snowpack ranges from average to below average in the major
tributaries of the Green River.
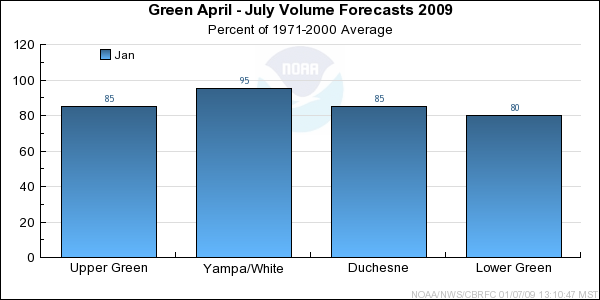
*Median of forecasts within each basin.
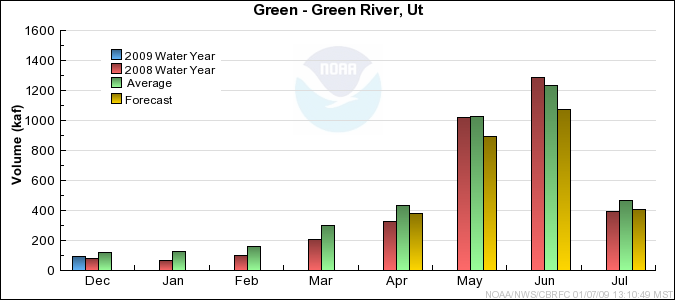
Upper Green Basin Conditions
Despite above average December precipitation, the snow water equivalency in the Upper Green Basin remains below
average. Low snowpack combined with the basin wide much below average soil moisture conditions resulted in ESP
model guidance near 80% of the April through July average. While the antecedent soil moisture conditions will not
change prior to runoff, there is ample time to accumulate snow in the upper basin. With this in mind, forecasts were kept at
the upper bound of guidance levels for points in the Upper Green resulting in near-to and below-average volume predictions.
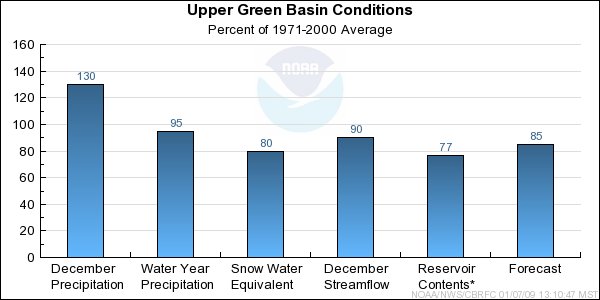
* Percent usable capacity, not percent average contents.
Click for multi-month Graph.
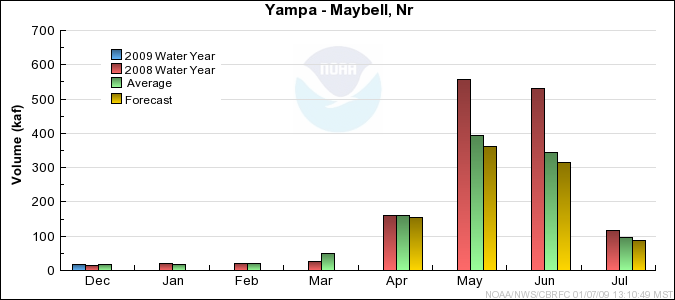
Yampa/White Basin Conditions
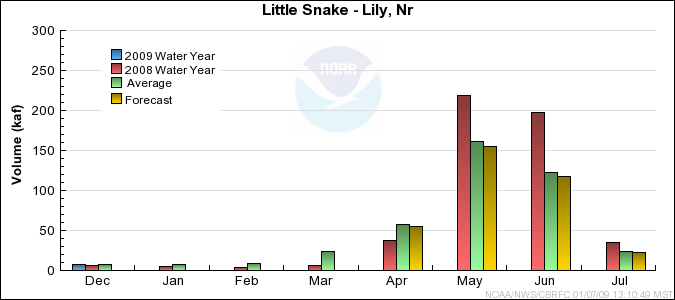
Currently, the Yampa and White River basins has the highest snowpack observations with most Snotel stations indicating average
or above average values for January 1st. While soil simulations indicate drier than average conditions in portions of this
region, headwater basins have near average conditions. Soil moisture deficits are not adversely effecting model guidance as much as in other
regions. April through July forecast indicate near average runoff volumes for the Yampa and White basins.
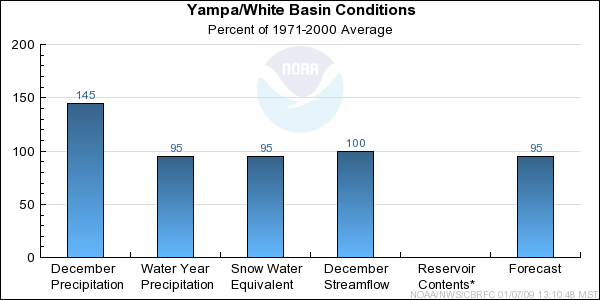
* Percent usable capacity, not percent average contents.
Click for multi-month Graph.
Duchesne Basin Conditions
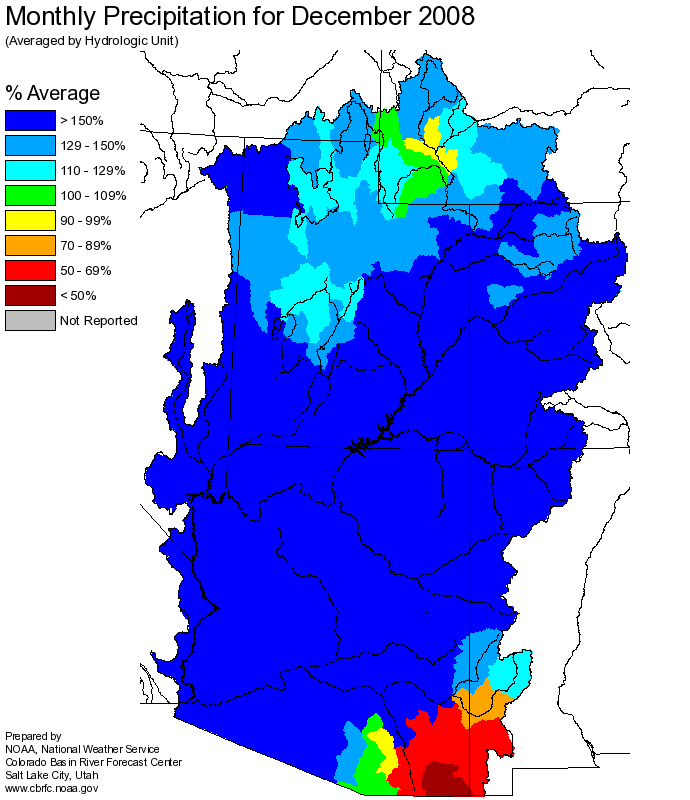
December precipitation was 140 percent of average. This brought the Snowpack in the Duchesne Basin from 37 Percent of average
on December 1st to 85 percent of average on January 1st. However, some Snotel stations located in the Eastern portion of the Uinta South slope
report below average conditions. Soil conditions in the Duchesne are similar to he Upper Green with many basins indicating much
below average conditions. Forecasts range near average on the headwaters of the basin to below average at downstream locations.
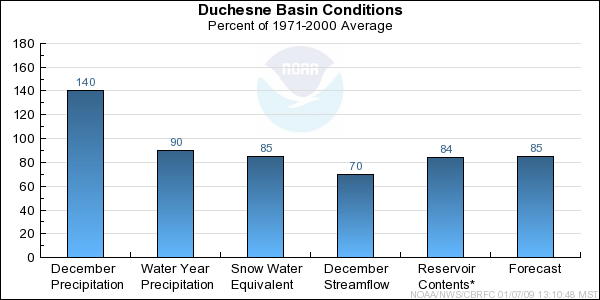
* Percent usable capacity, not percent average contents.
Click for multi-month Graph.
Lower Green Basin Conditions
The Lower Green Basin has the lowest snowpack in the Green Basin as of January 1st. Despite this, forecasts range from near average to below average.
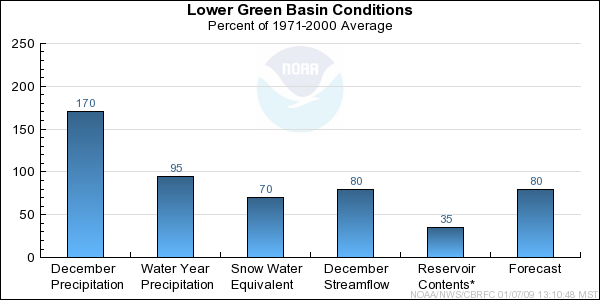
* Percent usable capacity, not percent average contents.
Click for multi-month Graph.
Differences between the full period forecasts and the residual forecasts may not exactly equal the actual observed volumes due to rounding conventions (see Definitions section).
Reservoir Monthly Inflow Forecasts
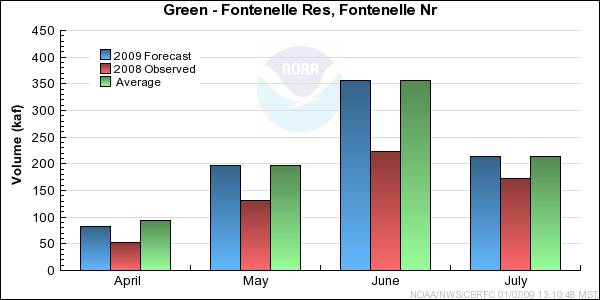
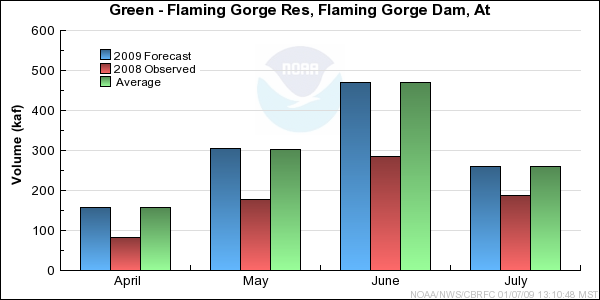
Monthly Streamflows
Precipitation Maps
Hydrologist: Ed Clark
