
NOAA, National Weather Service
Colorado Basin River Forecast Center
Salt Lake City, Utah
www.cbrfc.noaa.gov
| Prepared by Ashley Nielson NOAA, National Weather Service Colorado Basin River Forecast Center Salt Lake City, Utah www.cbrfc.noaa.gov |
| Forecast Period | 90% Exceedance Volume | 50% Exceedance Volume | Percent Average | 10% Exceedance Volume | |
| Green | |||||
| Daniel, Nr, Warren Bridge, At | April-July | 245 | 290 | 109 | 340 |
| Pine Ck | |||||
| Fremont Lk, Abv | April-July | 95 | 111 | 107 | 128 |
| New Fork | |||||
| Big Piney, Nr | April-July | 325 | 430 | 109 | 550 |
| Green | |||||
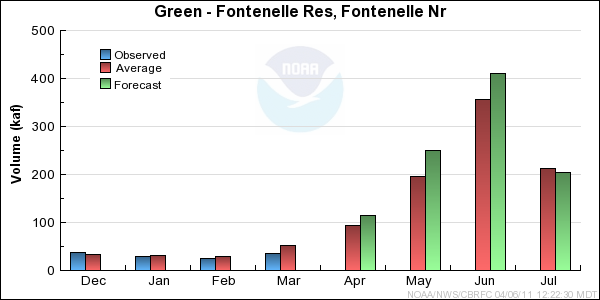
| Fontenelle Res, Fontenelle Nr | April-July | 690 | 980 | 114 | 1250 |
| Big Sandy | |||||
| Farson, Nr | April-July | 42 | 58 | 100 | 77 |
| Green | |||||
| Green River, Wy, Nr | April-July | 770 | 1020 | 117 | 1270 |
| Hams Fork | |||||
| Frontier, Nr, Pole Ck, Blo | April-July | 69 | 91 | 140 | 116 |
| Viva Naughton Res | April-July | 95 | 125 | 140 | 155 |
| Blacks Fork | |||||
| Robertson, Nr | April-July | 86 | 115 | 121 | 148 |
| Ef Smiths Fork | |||||
| Robertson, Nr | April-July | 25 | 36 | 124 | 49 |
| Green | |||||
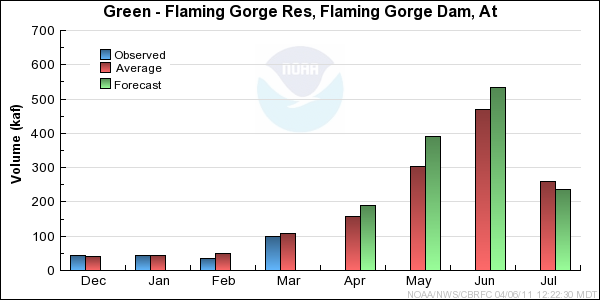
| Flaming Gorge Res, Flaming Gorge Dam, At | April-July | 975 | 1350 | 113 | 1850 |
| Forecast Period | 90% Exceedance Volume | 50% Exceedance Volume | Percent Average | 10% Exceedance Volume | |
| Yampa | |||||
| Stagecoach Rsvr, Abv | April-July | 33 | 50 | 135 | 65 |
| Steamboat Springs | April-July | 330 | 415 | 148 | 510 |
| Elk | |||||
| Milner, Nr | April-July | 420 | 500 | 154 | 605 |
| Elkhead Ck | |||||
| Long Gulch, Abv, Hayden, Nr | April-July | 83 | 115 | 162 | 152 |
| Yampa | |||||
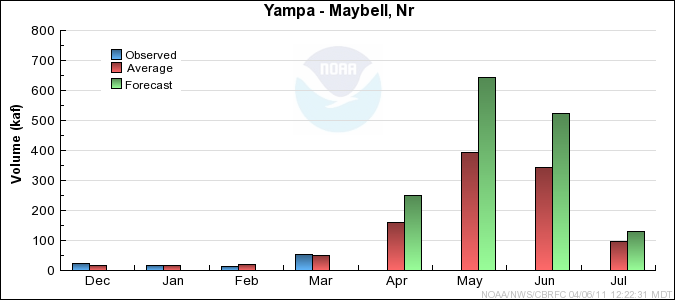
| Maybell, Nr | April-July | 1160 | 1550 | 157 | 1990 |
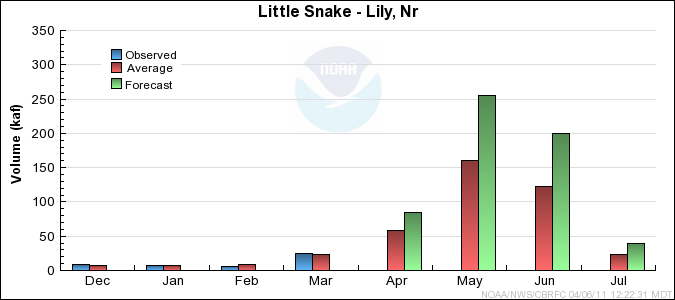
| Little Snake | |||||
| Slater, Nr | April-July | 184 | 235 | 148 | 290 |
| Dixon, Nr | April-July | 375 | 515 | 156 | 630 |
| Lily, Nr | April-July | 395 | 580 | 159 | 800 |
| White | |||||
| Meeker, Nr | April-July | 285 | 370 | 128 | 465 |
| Watson, Nr | April-July | 300 | 395 | 130 | 490 |
| Forecast Period | 90% Exceedance Volume | 50% Exceedance Volume | Percent Average | 10% Exceedance Volume | |
| Big Brush Ck | |||||
| Vernal, Nr, Red Fleet Res, Abv | April-July | 15.3 | 23 | 110 | 32 |
| Ashley Ck | |||||
| Vernal, Nr | April-July | 35 | 55 | 106 | 80 |
| West Fork Duchesne | |||||
| Vat Diversion, Blo | April-July | 25 | 32 | 171 | 40 |
| Duchesne | |||||
| Tabiona, Nr | April-July | 118 | 155 | 148 | 197 |
| Rock Ck | |||||
| Upper Stillwater Res | April-July | 107 | 125 | 152 | 145 |
| Mountain Home, Nr | April-July | 113 | 135 | 152 | 159 |
| Currant Ck | |||||
| Currant Ck Res | April-July | 26 | 40 | 160 | 57 |
| Strawberry | |||||
| Soldier Springs, Nr | April-July | 67 | 100 | 169 | 140 |
| Duchesne, Nr | April-July | 136 | 200 | 164 | 275 |
| Duchesne | |||||
| Duchesne, Nr, Knight Div, Abv | April-July | 230 | 290 | 154 | 360 |
| Lake Fork | |||||
| Moon Lake Res, Mtn Home, Nr | April-July | 83 | 100 | 147 | 118 |
| Yellowstone | |||||
| Altonah, Nr | April-July | 76 | 96 | 155 | 118 |
| Whiterocks | |||||
| Whiterocks, Nr | April-July | 48 | 70 | 125 | 96 |
| Uinta | |||||
| Neola, Nr | April-July | 76 | 112 | 142 | 155 |
| Duchesne | |||||
| Myton | April-July | 330 | 500 | 189 | 705 |
| Randlett, Nr | April-July | 385 | 625 | 192 | 900 |
| Forecast Period | 90% Exceedance Volume | 50% Exceedance Volume | Percent Average | 10% Exceedance Volume | |
| White | |||||
| Blo Tabbyune Ck, Soldier Summit, Nr | April-July | 19.1 | 25 | 144 | 32 |
| Fish Ck | |||||
| Scofield, Nr, Reservoir, Abv | April-July | 33 | 45 | 141 | 58 |
| Price | |||||
| Scofield Res, Scofield, Nr | April-July | 49 | 67 | 146 | 89 |
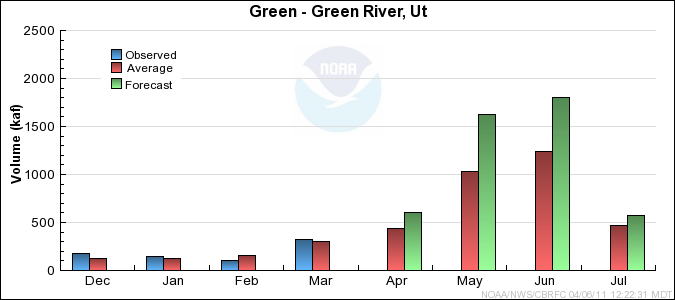
| Green | |||||
| Green River, Ut | April-July | 3290 | 4600 | 145 | 6140 |
| Huntington Ck | |||||
| Electric Lake | April-July | 15.2 | 20 | 127 | 25 |
| Huntington, Nr | April-July | 45 | 63 | 129 | 84 |
| Seeley Ck | |||||
| Joes Vly Res, Orangeville, Nr | April-July | 50 | 70 | 121 | 94 |
| Ferron Ck | |||||
| Ferron, Nr | April-July | 39 | 50 | 128 | 63 |
| Muddy Ck | |||||
| Emery, Nr | April-July | 22 | 30 | 151 | 40 |
| Seven Mile Ck | |||||
| Fish Lake, Nr | April-July | 5.9 | 9 | 129 | 12.7 |
| Pine Ck | |||||
| Escalante, Nr | April-July | 1.6 | 3 | 125 | 4.8 |
| Range | Round to | |
| 0-1.99 | 0.01 | |
| 2.0-19.9 | 0.1 | |
| 20-199 | 1.0 | |
| 200-999 | 5.0 | |
| 1000+ | 3 significant digits |