
NOAA, National Weather Service
Colorado Basin River Forecast Center
Salt Lake City, Utah
www.cbrfc.noaa.gov
| Prepared by Bill Reed NOAA, National Weather Service Colorado Basin River Forecast Center Salt Lake City, Utah www.cbrfc.noaa.gov |

| Forecast Period | 90% Exceedance Volume | 50% Exceedance Volume | Percent Average | 10% Exceedance Volume | |
| Green | |||||
| Daniel, Nr, Warren Bridge, At | April-July | 210 | 250 | 94 | 295 |
| May-July | 185 | 225 | 92 | 270 | |
| Pine Ck | |||||
| Fremont Lk, Abv | April-July | 85 | 100 | 96 | 116 |
| May-July | 82 | 97 | 95 | 113 | |
| New Fork | |||||
| Big Piney, Nr | April-July | 290 | 370 | 94 | 460 |
| May-July | 270 | 350 | 95 | 440 | |
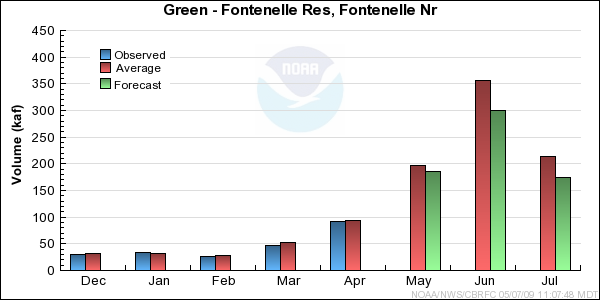
| Green | |||||
| Fontenelle Res, Fontenelle Nr | April-July | 570 | 750 | 87 | 960 |
| May-July | 480 | 660 | 86 | 870 | |
| Big Sandy | |||||
| Farson, Nr | April-July | 34 | 45 | 78 | 58 |
| May-July | 31 | 42 | 79 | 55 | |
| Green | |||||
| Green River, Wy, Nr | April-July | 575 | 765 | 87 | 985 |
| May-July | 480 | 670 | 86 | 890 | |
| Hams Fork | |||||
| Frontier, Nr, Pole Ck, Blo | April-July | 44 | 58 | 89 | 74 |
| May-July | 38 | 52 | 88 | 68 | |
| Viva Naughton Res | April-July | 57 | 80 | 90 | 107 |
| May-July | 49 | 72 | 95 | 99 | |
| Blacks Fork | |||||
| Robertson, Nr | April-July | 64 | 85 | 89 | 109 |
| May-July | 61 | 82 | 89 | 106 | |
| Ef Smiths Fork | |||||
| Robertson, Nr | April-July | 17.2 | 25 | 86 | 34 |
| May-July | 16.2 | 24 | 86 | 33 | |
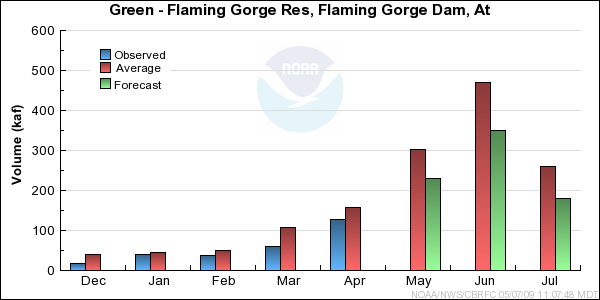
| Green | |||||
| Flaming Gorge Res, Flaming Gorge Dam, At | April-July | 590 | 890 | 75 | 1260 |
| May-July | 460 | 760 | 74 | 1130 |
| Forecast Period | 90% Exceedance Volume | 50% Exceedance Volume | Percent Average | 10% Exceedance Volume | |
| Yampa | |||||
| Stagecoach Rsvr, Abv | April-July | 19.7 | 29 | 100 | 42 |
| May-July | 12.7 | 22 | 100 | 35 | |
| Steamboat Springs | April-July | 225 | 275 | 98 | 330 |
| May-July | 185 | 235 | 98 | 290 | |
| Elk | |||||
| Milner, Nr | April-July | 290 | 350 | 108 | 420 |
| May-July | 245 | 305 | 109 | 375 | |
| Elkhead Ck | |||||
| Elkhead, Nr | April-July | 29 | 41 | 105 | 55 |
| May-July | 23 | 35 | 106 | 49 | |
| Maynard Gulch, Blo | April-July | 44 | 62 | 105 | 84 |
| May-July | 34 | 52 | 108 | 74 | |
| Fortification Ck | |||||
| Fortification, Nr | March-June | 4.9 | 8 | 107 | 12.2 |
| May-June | 2.5 | 4 | 100 | 6 | |
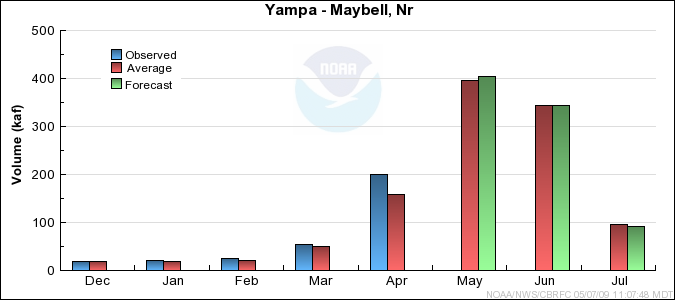
| Yampa | |||||
| Maybell, Nr | April-July | 850 | 1040 | 105 | 1260 |
| May-July | 650 | 840 | 101 | 1060 | |
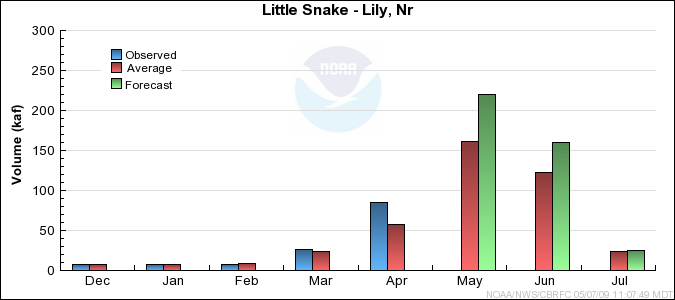
| Little Snake | |||||
| Slater, Nr | April-July | 167 | 205 | 129 | 250 |
| May-July | 142 | 180 | 127 | 225 | |
| Dixon, Nr | April-July | 330 | 440 | 133 | 565 |
| May-July | 265 | 375 | 132 | 500 | |
| Lily, Nr | April-July | 370 | 490 | 134 | 630 |
| May-July | 285 | 405 | 131 | 545 | |
| White | |||||
| Meeker, Nr | April-July | 220 | 290 | 100 | 370 |
| May-July | 186 | 255 | 98 | 355 | |
| Watson, Nr | April-July | 210 | 315 | 103 | 420 |
| May-July | 175 | 280 | 104 | 385 |
| Forecast Period | 90% Exceedance Volume | 50% Exceedance Volume | Percent Average | 10% Exceedance Volume | |
| Big Brush Ck | |||||
| Vernal, Nr, Red Fleet Res, Abv | April-July | 11.1 | 16 | 76 | 22 |
| May-July | 9.8 | 14.7 | 79 | 21 | |
| Ashley Ck | |||||
| Vernal, Nr | April-July | 32 | 42 | 81 | 53 |
| May-July | 30 | 40 | 82 | 51 | |
| Wf Duchesne | |||||
| Hanna, Nr | April-July | 13.9 | 21 | 88 | 30 |
| May-July | 11.6 | 18.7 | 85 | 28 | |
| Duchesne | |||||
| Tabiona, Nr | April-July | 64 | 87 | 83 | 114 |
| May-July | 55 | 78 | 82 | 105 | |
| Rock Ck | |||||
| Upper Stillwater Res | April-July | 57 | 69 | 84 | 82 |
| May-July | 53 | 65 | 82 | 78 | |
| Mountain Home, Nr | April-July | 64 | 78 | 88 | 94 |
| May-July | 60 | 74 | 87 | 90 | |
| Currant Ck | |||||
| Currant Ck Res | April-July | 16.2 | 23 | 92 | 32 |
| May-July | 7.5 | 14.3 | 65 | 23 | |
| Strawberry | |||||
| Soldier Springs, Nr | April-July | 39 | 55 | 93 | 75 |
| May-July | 24 | 40 | 85 | 60 | |
| Duchesne, Nr | April-July | 71 | 105 | 86 | 148 |
| May-July | 49 | 83 | 77 | 126 | |
| Duchesne | |||||
| Duchesne, Nr, Knight Div, Abv | April-July | 122 | 158 | 84 | 200 |
| May-July | 105 | 141 | 82 | 183 | |
| Lake Fork | |||||
| Moon Lake Res, Mtn Home, Nr | April-July | 44 | 55 | 81 | 68 |
| May-July | 42 | 53 | 82 | 66 | |
| Yellowstone | |||||
| Altonah, Nr | April-July | 44 | 55 | 89 | 68 |
| May-July | 41 | 52 | 88 | 65 | |
| Whiterocks | |||||
| Whiterocks, Nr | April-July | 35 | 48 | 86 | 63 |
| May-July | 33 | 46 | 87 | 61 | |
| Duchesne | |||||
| Myton | April-July | 139 | 200 | 75 | 275 |
| May-July | 104 | 165 | 69 | 240 | |
| Randlett, Nr | April-July | 135 | 240 | 74 | 385 |
| May-July | 100 | 205 | 69 | 350 |
| Forecast Period | 90% Exceedance Volume | 50% Exceedance Volume | Percent Average | 10% Exceedance Volume | |
| White | |||||
| Blo Tabbyune Ck, Soldier Summit, Nr | April-July | 13 | 17 | 98 | 22 |
| May-July | 9.2 | 13.2 | 97 | 17.9 | |
| Gooseberry Ck | |||||
| Scofield, Nr | April-July | 8.7 | 11.5 | 97 | 14.7 |
| May-July | 7.6 | 10.4 | 96 | 13.6 | |
| Price | |||||
| Scofield Res, Scofield, Nr | April-July | 36 | 45 | 98 | 56 |
| May-July | 30 | 39 | 98 | 50 | |
| Green | |||||
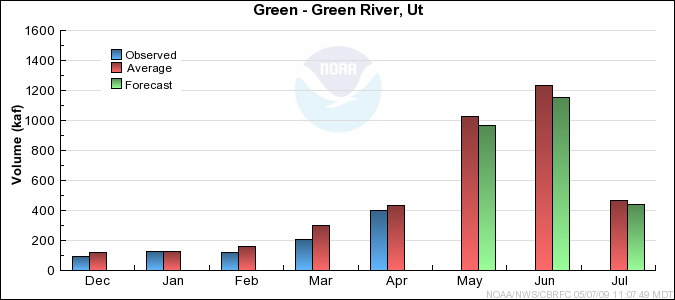
| Green River, Ut | April-July | 2510 | 2960 | 93 | 3410 |
| May-July | 2110 | 2560 | 93 | 3010 | |
| Huntington Ck | |||||
| Electric Lake | April-July | 11.1 | 15 | 96 | 19.5 |
| May-July | 9.4 | 13.3 | 95 | 17.8 | |
| Huntington, Nr | April-July | 30 | 40 | 82 | 51 |
| May-July | 26 | 36 | 80 | 47 | |
| Seeley Ck | |||||
| Joes Vly Res, Orangeville, Nr | April-July | 32 | 47 | 81 | 65 |
| May-July | 29 | 44 | 81 | 62 | |
| Ferron Ck | |||||
| Ferron, Nr | April-July | 21 | 27 | 69 | 34 |
| May-July | 18.7 | 25 | 69 | 32 | |
| Muddy Ck | |||||
| Emery, Nr | April-July | 10.7 | 16 | 80 | 22 |
| May-July | 9.8 | 15.1 | 84 | 21 |
| Range | Round to | |
| 0-1.99 | 0.01 | |
| 2.0-19.9 | 0.1 | |
| 20-199 | 1.0 | |
| 200-999 | 5.0 | |
| 1000+ | 3 significant digits |