New 1981-2010 Averages being used this year.
Note: This publication is currently undergoing major revisions. The current publication will be replaced with a new publication based on stakeholder requirements and scientific advances. We expect to begin sharing details on this soon. If you have input on content, format, or publication frequency at any time, please contact us at cbrfc.webmasters@noaa.gov.Green Water Supply Outlook, May 1, 2012Green Water Supply Outlook, May 1, 2012
Contents
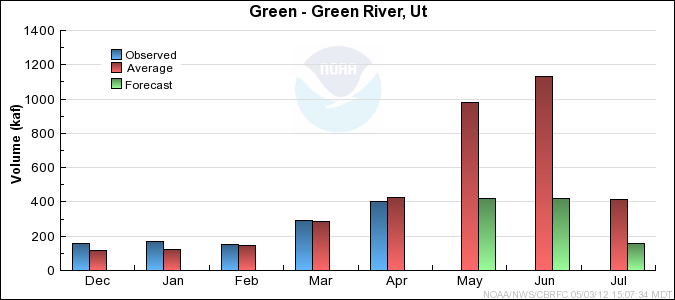
Green Summary
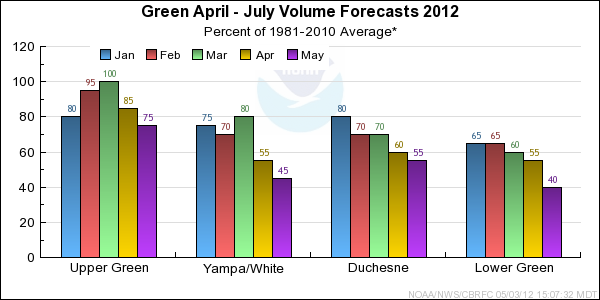
*Median of forecasts within each basin.
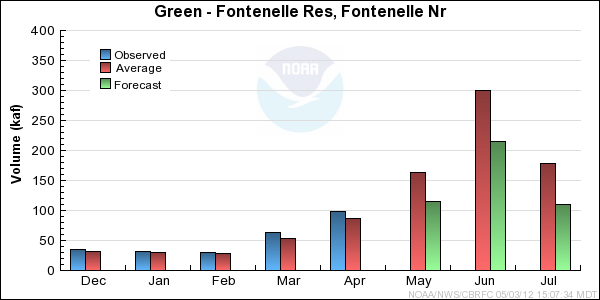
Upper Green Basin Conditions
The following conditions influenced this month's forecasts:
Precipitation:
Seasonal October through April
precipitation was 90 percent of average
in the Upper Green basin as a whole. April
precipitation was 65 percent of average.
Snow:
May 1st snow water equivalent was 50 percent of average in the basin as a whole as measured at
the snotel locations. It is important to note that the highest snotel location is at 9800 feet
in the Upper Green; however, the basin extends to elevations up to 13,000 feet. Nearly half of
the basin is not represented by the snotel network. Low and mid elevation snowmelt has continued with another month of above average
temperatures and below average precipitation. Remote sensing data suggests that a
considerable amount of snow remains at high elevations.
--- Upper Green basin
snow
water equivalent plot.
Streamflow:
April streamflow was near 110 percent of average.
Soil Moisture:
Modeled
soil
moisture states indicated near average to above average soil moisture conditions
last fall prior to snow accumulation.
Climate Forecasts:
Climate forecasts were not a factor because there is not a strong correlation
between La Nina conditions and winter precipitation in the Upper Green basin.
Forecast Summary:
Similar to March, April had much below average precipitation and above average temperatures. However, seasonal precipitation in the Upper
Green remains near average as a result of above average precipitation in months other than December, March and April.
The addition of another unseasonably warm and dry month in conjunction with continued snowmelt has resulted in significant
decreases in the April through July forecasts. Current April through July streamflow volume forecasts in the headwaters of the Upper Green have
decreased by 10 to 20 percent while forecasts for basins located in the Wyoming range (Ham's Fork) and the North Slope of the
Uintas decreased by 15 to 25 percent. April through July forecasts now range between 48 and 90 percent of average with a median value of 74 percent.

* Percent usable capacity, not percent average contents.
Click for multi-month Graph.
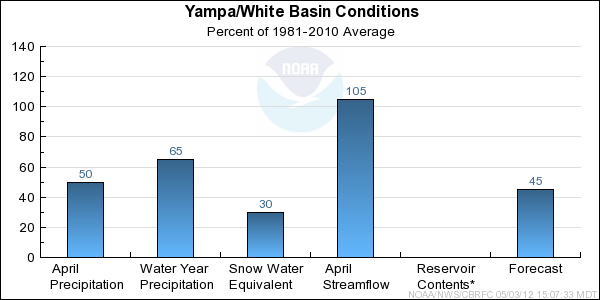
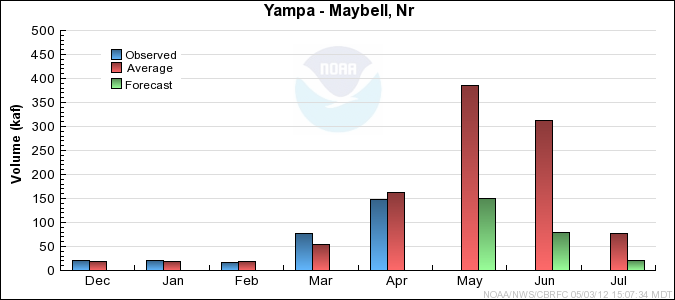
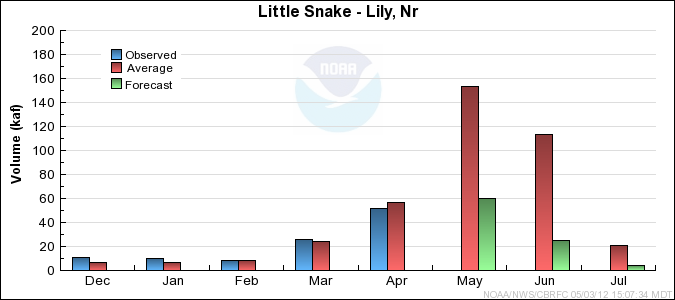
Yampa/White Basin Conditions
The following conditions influenced this month's forecasts:
Precipitation:
Seasonal October through April
precipitation was 65 percent of average
in the Yampa/White basin. April
precipitation was near 50 percent of average.
Snow:
April 1st snow water equivalent was 30 percent of average in the basin. Significant snowmelt
has continued with another month of above average temperatures and below average precipitation. Many of the snotel
locations have record low snow or have completely melted out. The majority of remaining snow is located above 10,000 feet.
--- Yampa basin
snow
water equivalent plot.
Streamflow:
April streamflow was 105 percent of average over the basin as a whole. However, some headwater locations
had monthly volumes between 140 and 160 percent of average.
Soil Moisture:
Modeled
soil
moisture states indicated above average to much above average soil moisture conditions
last fall prior to snow accumulation.
Climate Forecasts:
Climate forecasts were not a factor in the forecasts because there is not a strong correlation
between La Nina conditions and winter precipitation in the Yampa/White basin.
Forecast Summary:
Above average temperatures and much below average precipitation continue to prevail in the
Yampa/White. As a result, snow and water supply conditions have continued to deteriorate
rapidly. Unseasonably warm and dry conditions in April, have resulted in another significant
decrease in the April through July streamflow volume forecasts. Forecasts have decreased by and
additional 15 to 20 percent. Forecasts have decreased by as much as 50 percent from March 1 due
to the conditions in March and April and many of the May through July forecasts are in the bottom five
of the historical records. April through July forecasts now range between 32 and 55 percent of average
with a median value of 45 percent.
* Percent usable capacity, not percent average contents.
Click for multi-month Graph.
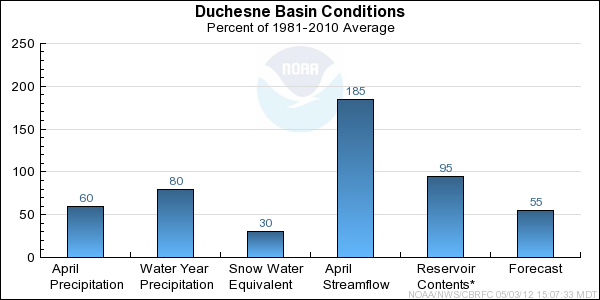
Duchesne Basin Conditions
The following conditions influenced this month's forecasts:
Precipitation:
Seasonal October through April
precipitation was 80 percent of average
in the Duchesne basin. April
precipitation was 60 percent of average.
Snow:
May 1st snow water equivalent was 30 percent of average in the basin. Significant snowmelt
has continued with another month of above average temperatures and below average precipitation. Many of the snotel
locations have record or near record low snow or have completely melted out.
The majority of remaining snow is located above 10,000 feet.
--- Duchesne basin
snow
water equivalent plot.
Streamflow:
April streamflow was near 185 percent of average over the basin as a whole. However, some headwater locations
had monthly volumes greater than 200 percent.
Soil Moisture:
Modeled
soil
moisture states indicated much above average soil moisture conditions
last fall prior to snow accumulation.
Climate Forecasts:
Climate forecasts were not a factor in the forecasts because there is not a strong correlation
between La Nina conditions and winter precipitation in the Duchesne basin.
Forecast Summary:
Similar to March, April had much below average precipitation and above average temperatures.
The addition of another unseasonably warm and dry month in conjunction with continued snowmelt has
resulted in another decrease in the April through July forecasts. Current April through July
streamflow volume forecasts decreased by 10 to 20 percent. May through July forecasts for many of the low
elevations basins such as Strawberry near Solider Springs and Currant Creek are in the bottom
five of the historical records. April through July forecasts now range between 20 and 68 percent of average with
a median value of 55 percent
* Percent usable capacity, not percent average contents.
Click for multi-month Graph.
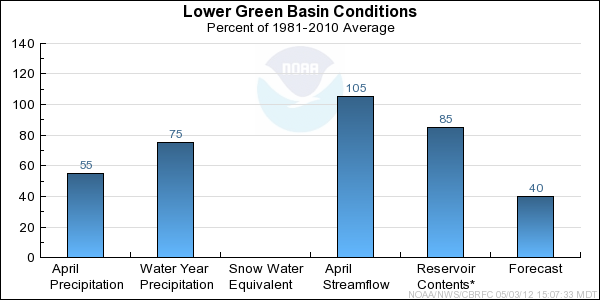
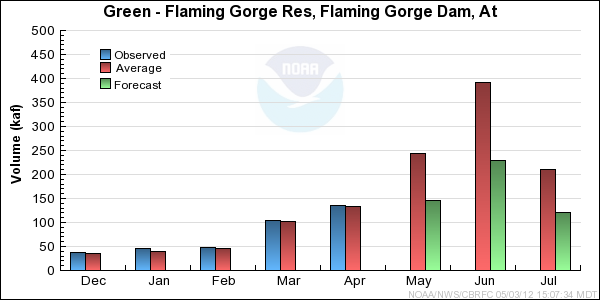
Lower Green Basin Conditions
The following conditions influenced this month's forecasts:
Precipitation:
Seasonal October through April
precipitation was 75 percent of average
in the Lower Green basin. April
precipitation was 55 percent of average.
Snow:
There is no snow remaining at any of the snotel sites. Any remaining snow is located at
the highest elevations.
--- Lower Green basin
snow
water equivalent plot.
Streamflow:
April streamflow was near 105 percent of average over the basin as a whole.
Soil Moisture:
Modeled
soil
moisture states indicated near average to above average soil moisture conditions
last fall prior to snow accumulation.
Climate Forecasts:
Climate forecasts were not a factor in the forecasts because there is not a strong correlation
between La Nina conditions and winter precipitation in the Lower Green basin.
Forecast Summary:
Similar to March, April had much below average precipitation and above average temperatures.
The addition of another unseasonably warm and dry month in conjunction with continued snowmelt has
resulted in another decrease in the April through July forecasts.
As a result, current April through July streamflow volume forecasts have decreased by 15 to 30 percent
and now range between 16 and 48 percent of average with a median value of 39 percent.
* Percent usable capacity, not percent average contents.
Click for multi-month Graph.
Differences between the full period forecasts and the residual forecasts may not exactly equal the actual observed volumes due to rounding conventions (see Definitions section).
Reservoir Monthly Inflow Forecasts
Monthly Streamflows
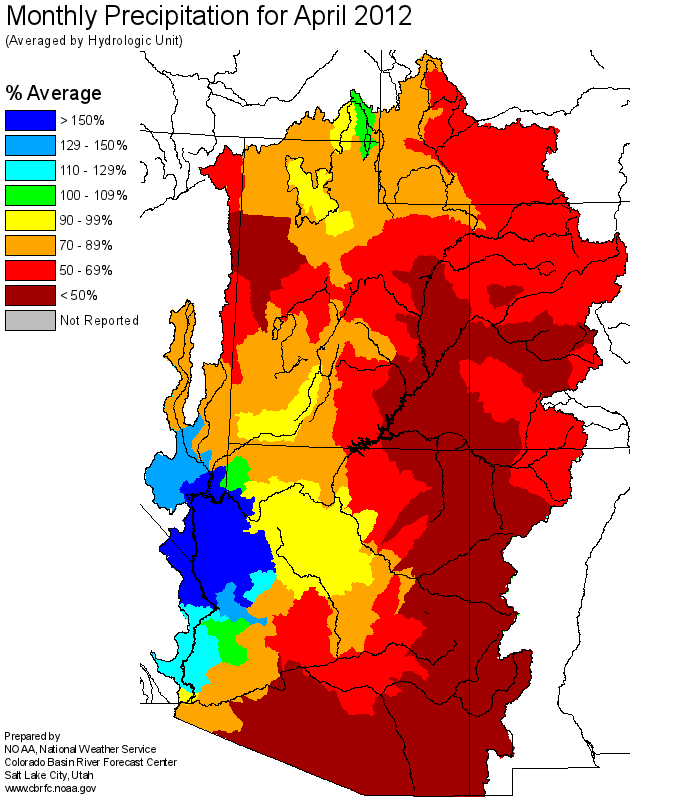
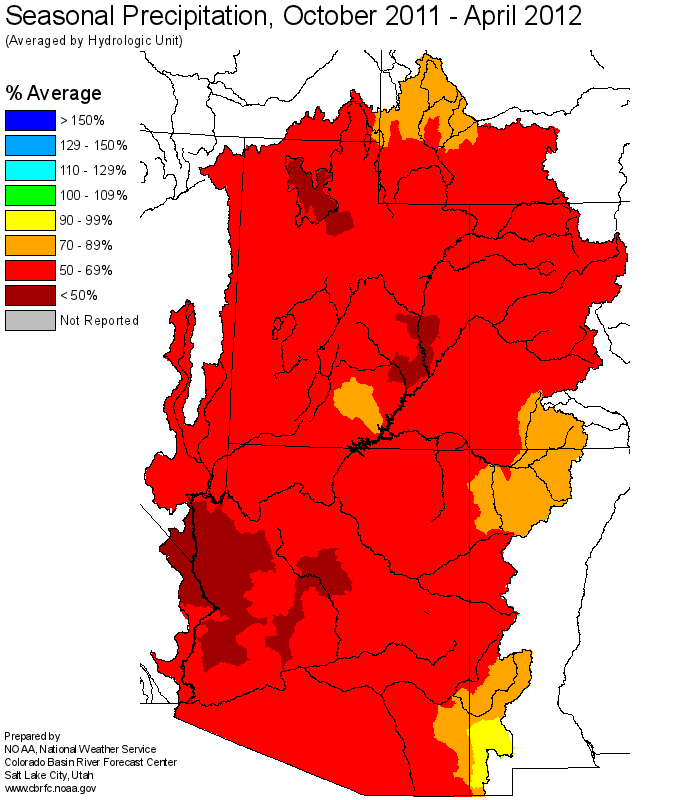
Precipitation Maps
Hydrologist: Ashley Nielson
