
NOAA, National Weather Service
Colorado Basin River Forecast Center
Salt Lake City, Utah
www.cbrfc.noaa.gov
| Prepared by Bill Reed NOAA, National Weather Service Colorado Basin River Forecast Center Salt Lake City, Utah www.cbrfc.noaa.gov |
| Forecast Period | 90% Exceedance Volume | 50% Exceedance Volume | Percent Average | 10% Exceedance Volume | |
| Green | |||||
| Daniel, Nr, Warren Bridge, At | April-July | 210 | 245 | 92 | 285 |
| June-July | 119 | 153 | 82 | 191 | |
| Pine Ck | |||||
| Fremont Lk, Abv | April-July | 85 | 100 | 96 | 116 |
| June-July | 59 | 76 | 90 | 95 | |
| New Fork | |||||
| Big Piney, Nr | April-July | 270 | 335 | 85 | 410 |
| June-July | 165 | 230 | 78 | 305 | |
| Green | |||||
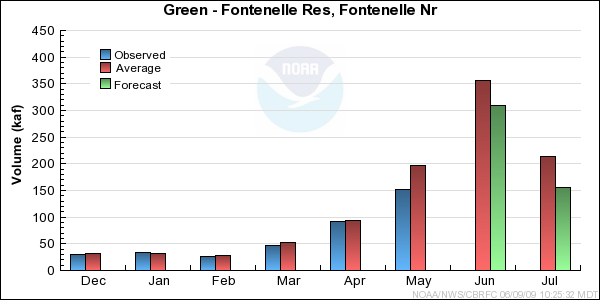
| Fontenelle Res, Fontenelle Nr | April-July | 560 | 705 | 82 | 870 |
| June-July | 320 | 465 | 82 | 630 | |
| Big Sandy | |||||
| Farson, Nr | April-July | 36 | 45 | 78 | 57 |
| June-July | 16.7 | 26 | 67 | 38 | |
| Green | |||||
| Green River, Wy, Nr | April-July | 575 | 725 | 83 | 905 |
| Hams Fork | |||||
| Frontier, Nr, Pole Ck, Blo | April-July | 46 | 55 | 85 | 66 |
| June-July | 15 | 24 | 75 | 35 | |
| Viva Naughton Res | April-July | 66 | 78 | 88 | 95 |
| June-July | 10.7 | 23 | 62 | 40 | |
| Blacks Fork | |||||
| Robertson, Nr | April-July | 60 | 80 | 84 | 102 |
| June-July | 21 | 39 | 58 | 63 | |
| Ef Smiths Fork | |||||
| Robertson, Nr | April-July | 17.2 | 25 | 86 | 34 |
| June-July | 7.3 | 14 | 67 | 23 | |
| Green | |||||
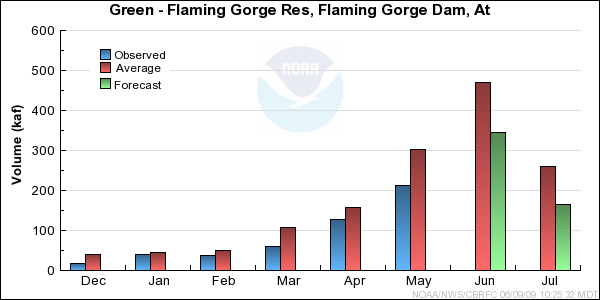
| Flaming Gorge Res, Flaming Gorge Dam, At | April-July | 630 | 850 | 71 | 1140 |
| June-July | 290 | 510 | 70 | 795 |
| Forecast Period | 90% Exceedance Volume | 50% Exceedance Volume | Percent Average | 10% Exceedance Volume | |
| Yampa | |||||
| Stagecoach Rsvr, Abv | April-July | 21 | 26 | 90 | 34 |
| June-July | 4.9 | 10 | 70 | 17.8 | |
| Steamboat Springs | April-July | 225 | 260 | 93 | 300 |
| June-July | 61 | 95 | 69 | 136 | |
| Elk | |||||
| Milner, Nr | April-July | 305 | 340 | 105 | 380 |
| June-July | 64 | 99 | 60 | 141 | |
| Elkhead Ck | |||||
| Elkhead, Nr | April-July | 38 | 41 | 105 | 46 |
| June-July | 2.6 | 6 | 71 | 10.8 | |
| Maynard Gulch, Blo | April-July | 57 | 62 | 105 | 69 |
| June-July | 4 | 9 | 75 | 16 | |
| Fortification Ck | |||||
| Fortification, Nr | March-June | 7.2 | 8 | 107 | 9.8 |
| June-June | 0.2 | 1 | 74 | 2.8 | |
| Yampa | |||||
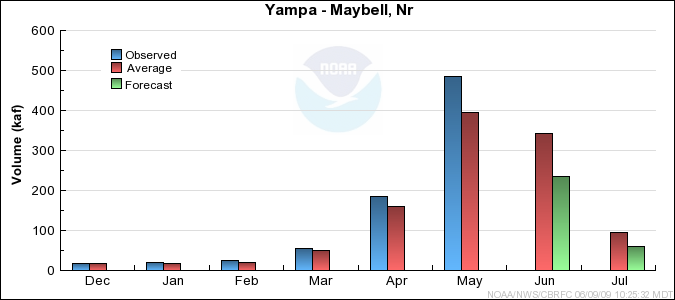
| Maybell, Nr | April-July | 860 | 965 | 97 | 1080 |
| June-July | 191 | 295 | 67 | 415 | |
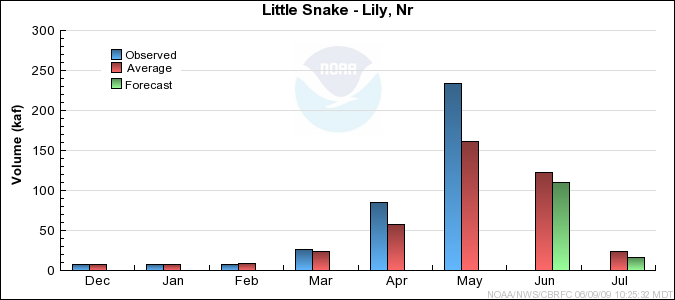
| Little Snake | |||||
| Slater, Nr | April-July | 164 | 185 | 116 | 210 |
| June-July | 39 | 60 | 83 | 85 | |
| Dixon, Nr | April-July | 340 | 390 | 118 | 450 |
| June-July | 74 | 122 | 92 | 182 | |
| Lily, Nr | April-July | 395 | 445 | 122 | 505 |
| June-July | 77 | 126 | 85 | 188 | |
| White | |||||
| Meeker, Nr | April-July | 235 | 265 | 91 | 305 |
| June-July | 60 | 92 | 57 | 131 | |
| Watson, Nr | April-July | 235 | 265 | 87 | 305 |
| June-July | 64 | 96 | 56 | 135 |
| Forecast Period | 90% Exceedance Volume | 50% Exceedance Volume | Percent Average | 10% Exceedance Volume | |
| Big Brush Ck | |||||
| Vernal, Nr, Red Fleet Res, Abv | April-July | 14 | 16 | 76 | 19 |
| June-July | 2.8 | 5.1 | 51 | 8.2 | |
| Ashley Ck | |||||
| Vernal, Nr | April-July | 24 | 32 | 62 | 42 |
| June-July | 8.5 | 16.6 | 59 | 26 | |
| Wf Duchesne | |||||
| Hanna, Nr | April-July | 17.2 | 21 | 88 | 26 |
| June-July | 2.6 | 6.4 | 53 | 11.8 | |
| Duchesne | |||||
| Tabiona, Nr | April-July | 74 | 90 | 86 | 111 |
| June-July | 16 | 32 | 52 | 53 | |
| Rock Ck | |||||
| Upper Stillwater Res | April-July | 59 | 69 | 84 | 80 |
| June-July | 26 | 38 | 67 | 52 | |
| Mountain Home, Nr | April-July | 66 | 79 | 89 | 93 |
| June-July | 22 | 34 | 55 | 48 | |
| Currant Ck | |||||
| Currant Ck Res | April-July | 19 | 23 | 92 | 29 |
| June-July | 4.1 | 8.4 | 71 | 14.2 | |
| Strawberry | |||||
| Soldier Springs, Nr | April-July | 48 | 55 | 93 | 65 |
| June-July | 4 | 11 | 68 | 21 | |
| Duchesne, Nr | April-July | 92 | 105 | 86 | 125 |
| June-July | 7.6 | 21 | 45 | 41 | |
| Duchesne | |||||
| Duchesne, Nr, Knight Div, Abv | April-July | 136 | 158 | 84 | 188 |
| June-July | 24 | 46 | 39 | 76 | |
| Lake Fork | |||||
| Moon Lake Res, Mtn Home, Nr | April-July | 40 | 50 | 74 | 61 |
| June-July | 20 | 30 | 64 | 42 | |
| Yellowstone | |||||
| Altonah, Nr | April-July | 45 | 55 | 89 | 66 |
| June-July | 18 | 27 | 60 | 38 | |
| Whiterocks | |||||
| Whiterocks, Nr | April-July | 35 | 44 | 79 | 54 |
| June-July | 11.6 | 20 | 53 | 31 | |
| Duchesne | |||||
| Myton | April-July | 170 | 200 | 75 | 255 |
| June-July | 6.5 | 37 | 25 | 92 | |
| Randlett, Nr | April-July | 180 | 225 | 69 | 305 |
| June-July | 9.4 | 54 | 28 | 135 |
| Forecast Period | 90% Exceedance Volume | 50% Exceedance Volume | Percent Average | 10% Exceedance Volume | |
| White | |||||
| Blo Tabbyune Ck, Soldier Summit, Nr | April-July | 16 | 17 | 98 | 18.5 |
| June-July | 0.85 | 1.9 | 45 | 3.4 | |
| Gooseberry Ck | |||||
| Scofield, Nr | April-July | 8.5 | 10.5 | 88 | 13.2 |
| June-July | 2 | 4 | 85 | 6.7 | |
| Price | |||||
| Scofield Res, Scofield, Nr | April-July | 36 | 40 | 87 | 46 |
| June-July | 3.6 | 7.4 | 49 | 13.1 | |
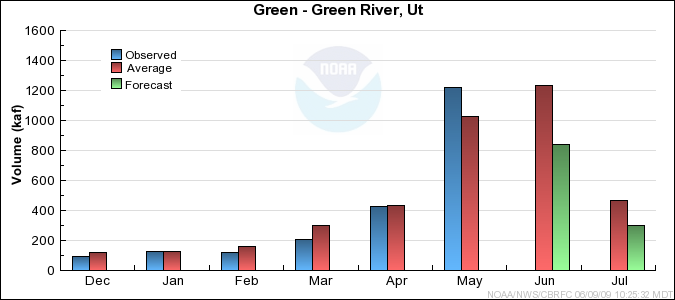
| Green | |||||
| Green River, Ut | April-July | 2390 | 2780 | 88 | 3170 |
| June-July | 750 | 1140 | 67 | 1530 | |
| Huntington Ck | |||||
| Electric Lake | April-July | 13.4 | 15 | 96 | 17 |
| June-July | 2.4 | 4 | 69 | 6 | |
| Huntington, Nr | April-July | 34 | 40 | 82 | 46 |
| June-July | 16.6 | 23 | 85 | 29 | |
| Seeley Ck | |||||
| Joes Vly Res, Orangeville, Nr | April-July | 38 | 47 | 81 | 59 |
| June-July | 8.7 | 17.4 | 48 | 29 | |
| Ferron Ck | |||||
| Ferron, Nr | April-July | 25 | 27 | 69 | 30 |
| June-July | 2.5 | 4.9 | 21 | 8.1 | |
| Muddy Ck | |||||
| Emery, Nr | April-July | 12.9 | 16 | 80 | 19.9 |
| June-July | 4.2 | 7.3 | 61 | 11.2 |
| Range | Round to | |
| 0-1.99 | 0.01 | |
| 2.0-19.9 | 0.1 | |
| 20-199 | 1.0 | |
| 200-999 | 5.0 | |
| 1000+ | 3 significant digits |