
NOAA, National Weather Service
Colorado Basin River Forecast Center
Salt Lake City, Utah
www.cbrfc.noaa.gov
| Prepared by Ashley Nielson NOAA, National Weather Service Colorado Basin River Forecast Center Salt Lake City, Utah www.cbrfc.noaa.gov |


| Forecast Period | 90% Exceedance Volume | 50% Exceedance Volume | Percent Average | 10% Exceedance Volume | |
| Green | |||||
| Daniel, Nr, Warren Bridge, At | April-July | 315 | 350 | 132 | 390 |
| June-July | 265 | 300 | 160 | 340 | |
| Pine Ck | |||||
| Fremont Lk, Abv | April-July | 113 | 128 | 123 | 143 |
| June-July | 105 | 120 | 143 | 135 | |
| New Fork | |||||
| Big Piney, Nr | April-July | 455 | 535 | 135 | 620 |
| June-July | 390 | 470 | 159 | 555 | |
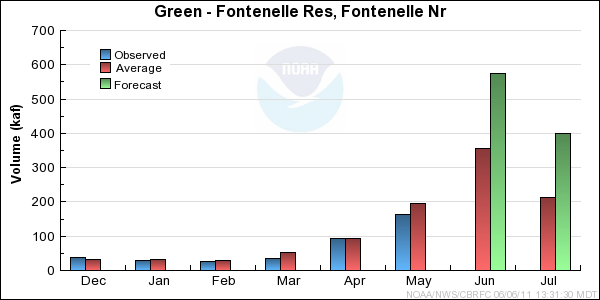
| Green | |||||
| Fontenelle Res, Fontenelle Nr | April-July | 1030 | 1230 | 143 | 1460 |
| June-July | 770 | 975 | 171 | 1200 | |
| Big Sandy | |||||
| Farson, Nr | April-July | 52 | 66 | 114 | 82 |
| June-July | 41 | 55 | 141 | 71 | |
| Green | |||||
| Green River, Wy, Nr | April-July | 1050 | 1270 | 145 | 1500 |
| Hams Fork | |||||
| Frontier, Nr, Pole Ck, Blo | April-July | 95 | 110 | 169 | 125 |
| June-July | 65 | 80 | 250 | 95 | |
| Viva Naughton Res | April-July | 140 | 162 | 182 | 187 |
| June-July | 68 | 90 | 243 | 115 | |
| Blacks Fork | |||||
| Robertson, Nr | April-July | 131 | 153 | 161 | 177 |
| June-July | 108 | 130 | 194 | 154 | |
| Ef Smiths Fork | |||||
| Robertson, Nr | April-July | 40 | 50 | 172 | 61 |
| June-July | 35 | 45 | 214 | 56 | |
| Green | |||||
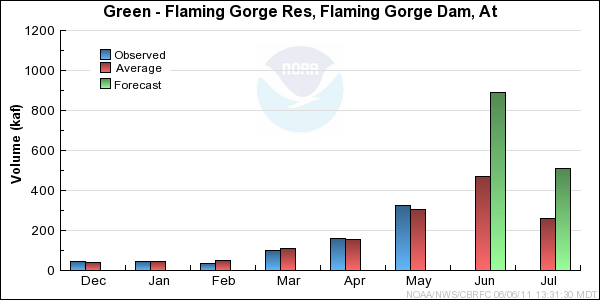
| Flaming Gorge Res, Flaming Gorge Dam, At | April-July | 1620 | 1890 | 159 | 2180 |
| June-July | 1130 | 1400 | 192 | 1690 |
| Forecast Period | 90% Exceedance Volume | 50% Exceedance Volume | Percent Average | 10% Exceedance Volume | |
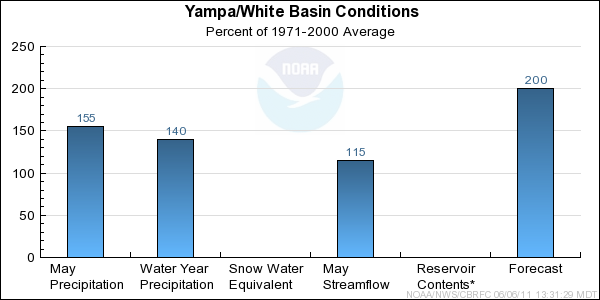
| Yampa | |||||
| Stagecoach Rsvr, Abv | April-July | 55 | 63 | 170 | 73 |
| June-July | 26 | 34 | 197 | 44 | |
| Steamboat Springs | April-July | 465 | 520 | 186 | 580 |
| June-July | 295 | 350 | 254 | 410 | |
| Elk | |||||
| Milner, Nr | April-July | 625 | 700 | 215 | 780 |
| June-July | 375 | 450 | 271 | 530 | |
| Elkhead Ck | |||||
| Long Gulch, Abv, Hayden, Nr | April-July | 125 | 141 | 199 | 160 |
| June-July | 24 | 40 | 408 | 59 | |
| Yampa | |||||
| Maybell, Nr | April-July | 1790 | 1990 | 201 | 2210 |
| June-July | 1030 | 1230 | 280 | 1450 | |
| Little Snake | |||||
| Slater, Nr | April-July | 310 | 345 | 217 | 385 |
| June-July | 182 | 220 | 306 | 260 | |
| Dixon, Nr | April-July | 650 | 740 | 224 | 845 |
| June-July | 310 | 400 | 303 | 505 | |
| Lily, Nr | April-July | 780 | 885 | 242 | 1000 |
| June-July | 405 | 510 | 345 | 630 | |
| White | |||||
| Meeker, Nr | April-July | 405 | 465 | 160 | 535 |
| June-July | 280 | 340 | 213 | 410 | |
| Watson, Nr | April-July | 435 | 495 | 162 | 560 |
| June-July | 290 | 350 | 205 | 415 |
| Forecast Period | 90% Exceedance Volume | 50% Exceedance Volume | Percent Average | 10% Exceedance Volume | |
| Big Brush Ck | |||||
| Vernal, Nr, Red Fleet Res, Abv | April-July | 19 | 22 | 105 | 27 |
| June-July | 8.2 | 12 | 120 | 16.5 | |
| Ashley Ck | |||||
| Vernal, Nr | April-July | 44 | 58 | 112 | 75 |
| June-July | 37 | 51 | 182 | 68 | |
| West Fork Duchesne | |||||
| Vat Diversion, Blo | April-July | 34 | 42 | 225 | 51 |
| June-July | 26 | 34 | 343 | 43 | |
| Duchesne | |||||
| Tabiona, Nr | April-July | 168 | 205 | 195 | 235 |
| June-July | 121 | 160 | 262 | 190 | |
| Rock Ck | |||||
| Upper Stillwater Res | April-July | 119 | 142 | 173 | 167 |
| June-July | 107 | 130 | 228 | 155 | |
| Mountain Home, Nr | April-July | 132 | 157 | 176 | 185 |
| June-July | 115 | 140 | 226 | 168 | |
| Currant Ck | |||||
| Currant Ck Res | April-July | 47 | 56 | 224 | 66 |
| June-July | 21 | 30 | 254 | 40 | |
| Strawberry | |||||
| Soldier Springs, Nr | April-July | 122 | 139 | 236 | 159 |
| June-July | 32 | 49 | 304 | 69 | |
| Duchesne, Nr | April-July | 255 | 295 | 242 | 335 |
| June-July | 83 | 120 | 255 | 163 | |
| Duchesne | |||||
| Duchesne, Nr, Knight Div, Abv | April-July | 310 | 360 | 191 | 430 |
| June-July | 250 | 300 | 256 | 370 | |
| Lake Fork | |||||
| Moon Lake Res, Mtn Home, Nr | April-July | 106 | 126 | 185 | 148 |
| June-July | 90 | 110 | 234 | 132 | |
| Yellowstone | |||||
| Altonah, Nr | April-July | 97 | 115 | 185 | 135 |
| June-July | 82 | 100 | 222 | 120 | |
| Whiterocks | |||||
| Whiterocks, Nr | April-July | 66 | 83 | 148 | 102 |
| June-July | 43 | 70 | 184 | 97 | |
| Uinta | |||||
| Neola, Nr | April-July | 123 | 143 | 181 | 163 |
| June-July | 110 | 130 | 228 | 150 | |
| Duchesne | |||||
| Myton | April-July | 580 | 690 | 260 | 835 |
| June-July | 365 | 475 | 319 | 620 | |
| Randlett, Nr | April-July | 705 | 890 | 274 | 1110 |
| June-July | 475 | 660 | 346 | 880 |
| Forecast Period | 90% Exceedance Volume | 50% Exceedance Volume | Percent Average | 10% Exceedance Volume | |
| White | |||||
| Blo Tabbyune Ck, Soldier Summit, Nr | April-July | 33 | 36 | 207 | 39 |
| June-July | 6.5 | 9 | 214 | 12 | |
| Fish Ck | |||||
| Scofield, Nr, Reservoir, Abv | April-July | 62 | 68 | 213 | 74 |
| June-July | 34 | 40 | 348 | 46 | |
| Price | |||||
| Scofield Res, Scofield, Nr | April-July | 73 | 88 | 191 | 107 |
| June-July | 35 | 50 | 331 | 69 | |
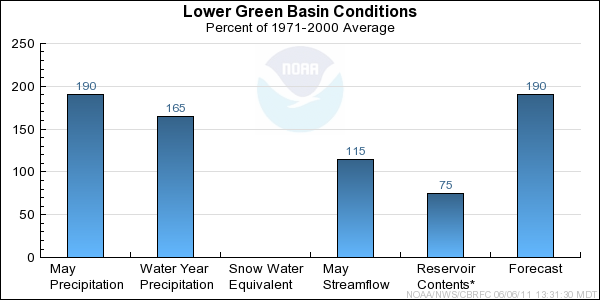
| Green | |||||
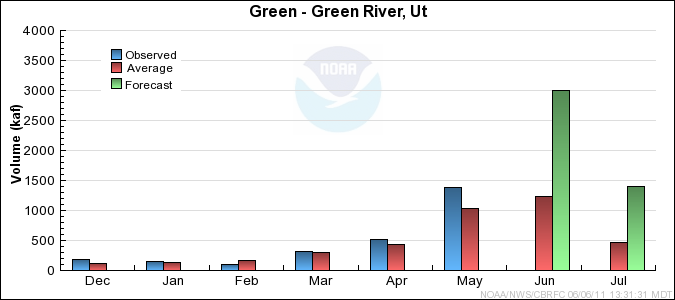
| Green River, Ut | April-July | 5550 | 6290 | 198 | 7100 |
| June-July | 3660 | 4400 | 257 | 5210 | |
| Huntington Ck | |||||
| Electric Lake | April-July | 25 | 29 | 185 | 33 |
| June-July | 16.2 | 20 | 345 | 24 | |
| Huntington, Nr | April-July | 77 | 87 | 178 | 98 |
| June-July | 55 | 65 | 241 | 76 | |
| Seeley Ck | |||||
| Joes Vly Res, Orangeville, Nr | April-July | 75 | 95 | 164 | 118 |
| June-July | 55 | 75 | 208 | 98 | |
| Ferron Ck | |||||
| Ferron, Nr | April-July | 55 | 64 | 164 | 73 |
| June-July | 41 | 50 | 217 | 59 | |
| Muddy Ck | |||||
| Emery, Nr | April-July | 28 | 34 | 171 | 41 |
| June-July | 19.9 | 26 | 218 | 33 | |
| Seven Mile Ck | |||||
| Fish Lake, Nr | April-July | 0 | 0 | 0 | 0 |
| June-July | 0 | 0 | 0 | 0 | |
| - | 0 | 0 | 0 | 0 |
| Range | Round to | |
| 0-1.99 | 0.01 | |
| 2.0-19.9 | 0.1 | |
| 20-199 | 1.0 | |
| 200-999 | 5.0 | |
| 1000+ | 3 significant digits |

