Note: This publication is currently undergoing major revisions. The current publication will be replaced with a new publication based on stakeholder requirements and scientific advances. We expect to begin sharing details on this soon. If you have input on content, format, or publication frequency at any time, please contact us at cbrfc.webmasters@noaa.gov.Lower Colorado Water Supply Outlook, January 1, 2008Lower Colorado Water Supply Outlook, January 1, 2008
Contents
Lower Colorado Summary
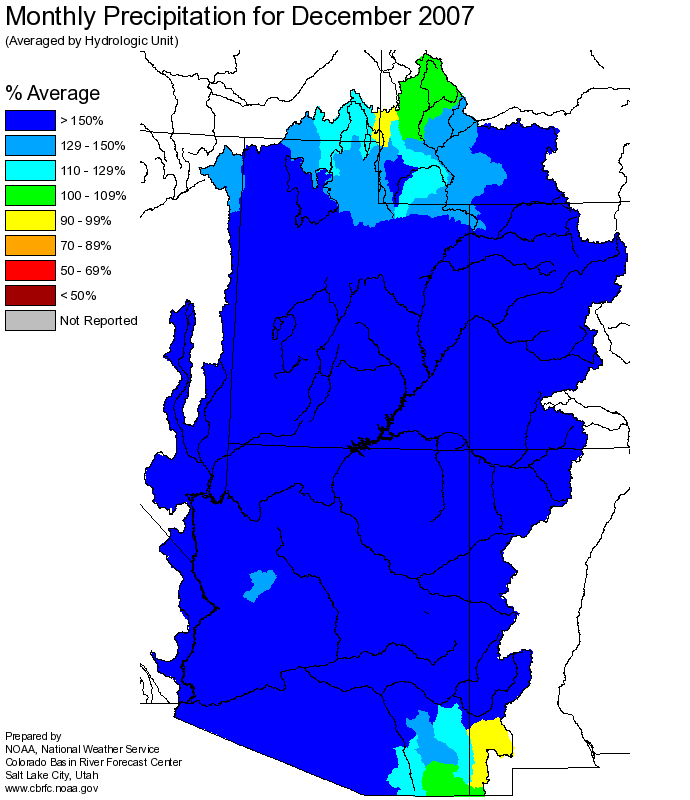
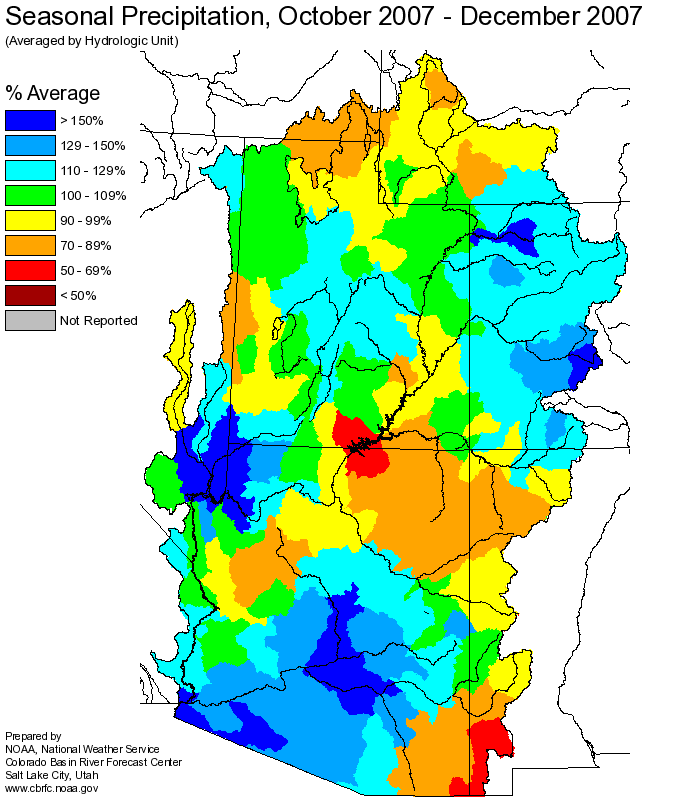
Significant precipitation in December resulted in many foreast points experiencing
streamflows in excess of 200 percent of the December median flow. An above average
snowpack exists in the upper Salt, San Francisco, and Little Colorado Basins. With
additional precipitation anticipated the first half of January most seasonal runoff
volumes are forecast to meet or exceed their median flows.
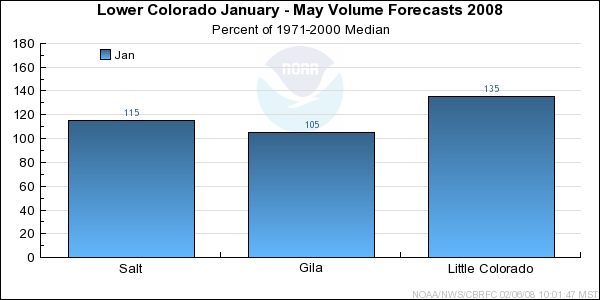
*Median of forecasts within each basin.
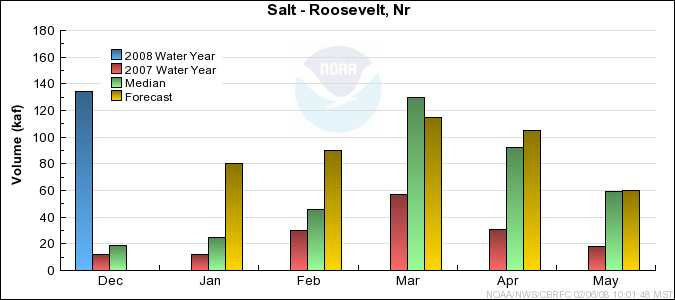
Salt Basin Conditions
January through May runoff volumes in the Salt River Basin are expected to range from near
100 to 150 percent of the median. The snowpack in the upper Salt Basin ranges from
70 to 145 percent of average. Much above median flows are anticipated for January
due to storms the first half of the month.
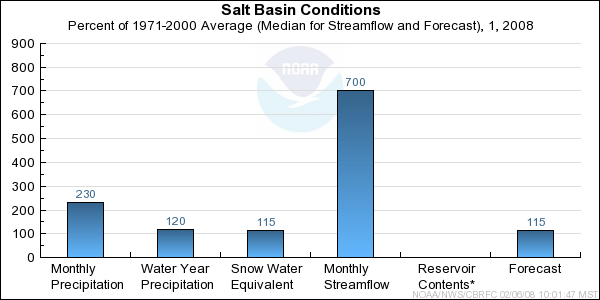
* Percent usable capacity, not percent average contents.
Click for multi-month Graph.
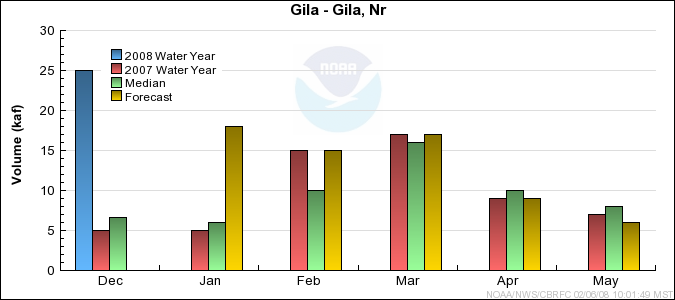
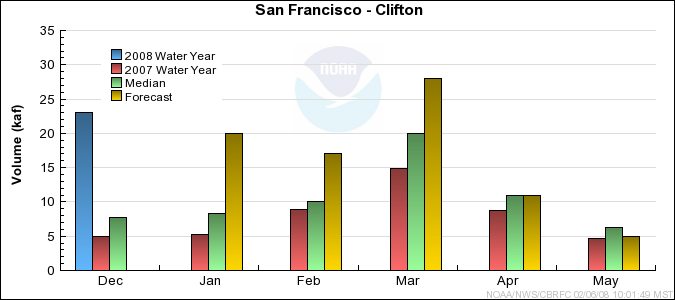
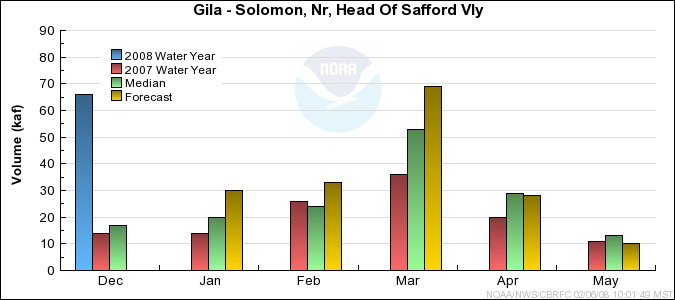
Gila Basin Conditions
January through May runoff volumes in the Gila River Basin are expected to range from near
90 to 115 percent of median. Below average snowpack exists in the Gila headwaters while
above average snowpack exists in the San Francisco drainage. Anticipated storms in January
are expected to contribute toward seasonal runoff volumes reaching forecast levels.
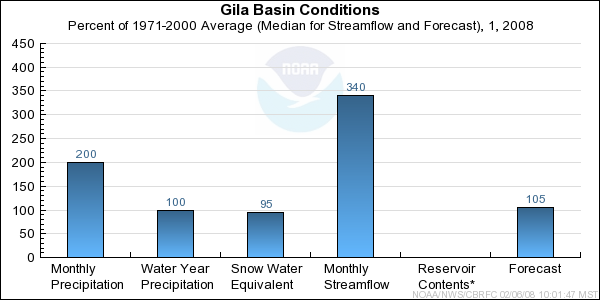
* Percent usable capacity, not percent average contents.
Click for multi-month Graph.
Little Colorado Basin Conditions
January through May runoff volumes in the Little Colorado Basin are expected to range from
near 80 to 160 percent of median. Above average precipitation was received in December.
Additional storms anticipated in January and an above average snowpack in the southern headwaters
of the Little Colorado are expected to contribute to the forecast levels.
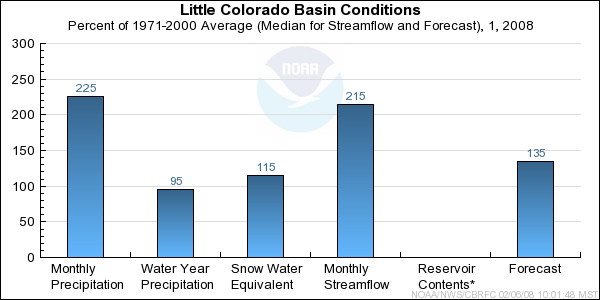
* Percent usable capacity, not percent average contents.
Click for multi-month Graph.
Differences between the full period forecasts and the residual forecasts may not exactly equal the actual observed volumes due to rounding conventions (see Definitions section).
Monthly Streamflows
Precipitation Maps
Hydrologist: G. Smith
