Note: This publication is currently undergoing major revisions. The current publication will be replaced with a new publication based on stakeholder requirements and scientific advances. We expect to begin sharing details on this soon. If you have input on content, format, or publication frequency at any time, please contact us at cbrfc.webmasters@noaa.gov.Lower Colorado Water Supply Outlook, January 1, 2009Lower Colorado Water Supply Outlook, January 1, 2009
Contents
Lower Colorado Summary
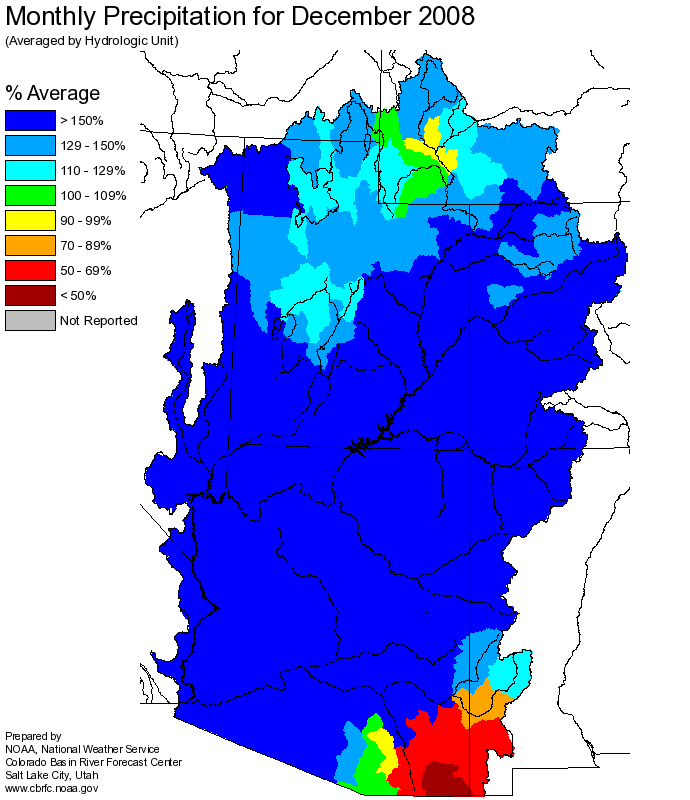
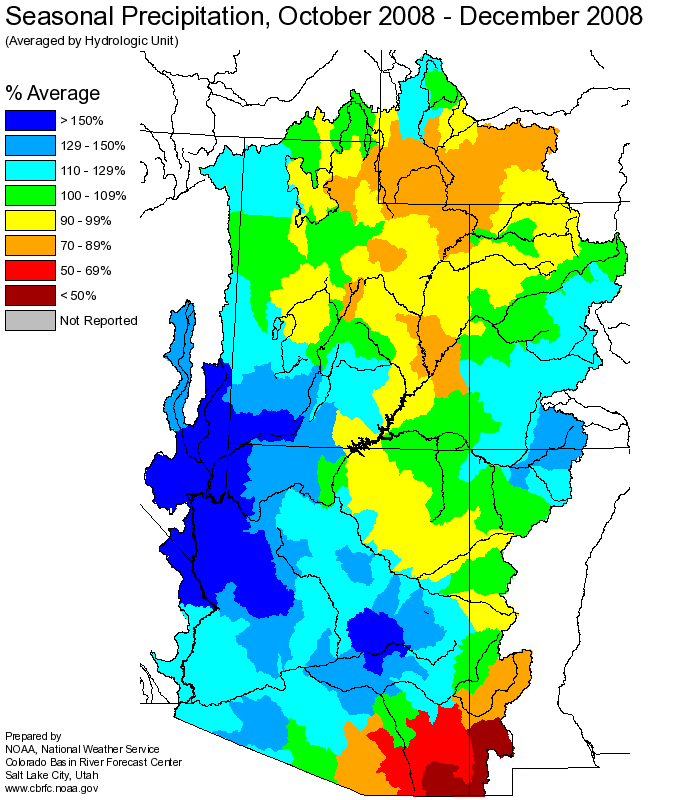
Precipitation in December ranged from near average to over 300 percent of average
across most of the Lower Colorado River Basin. The exception was the extreme southeast
corner of Arizona where much below average precipitation was received. December
streamflows were near or slightly below median values in the upper Gila and parts of the
Little Colorado Basin. Much above median streamflow was observed in the Salt River Basin.
Significant snowpack exists for this time of year at the higher elevations, particularly in the Upper
Salt Basin, White Mountains, Verde, and Little Colorado drainages. In these areas average annual seasonal
peak snow has already been exceeded. Snowmelt, in general, is a smaller component than rainfall to seasonal
streamflow volumes. In the absence of rainfall events during the forecast period, snowmelt is the primary
contributor. However, since snow is limited to the higest elevations, areal coverage is only a small percentage
of most basins. Runoff volumes due solely to snowmelt are much smaller than runoff produced from basin-wide rain
events over the course of a season.
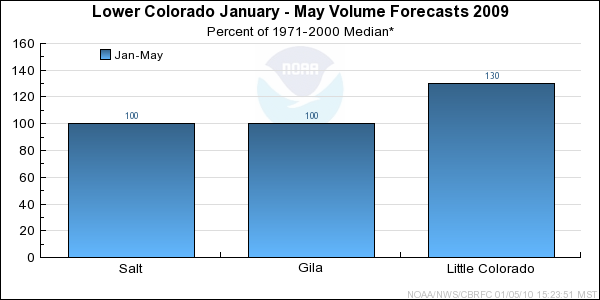
*Median of forecasts within each basin.
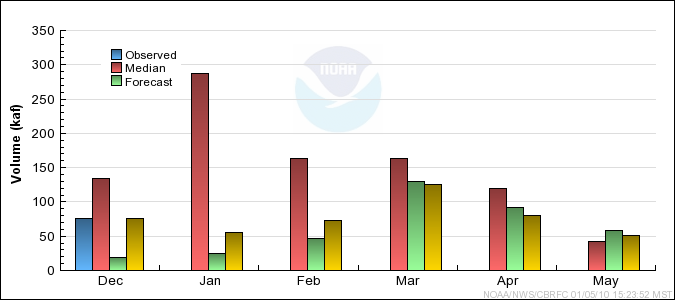
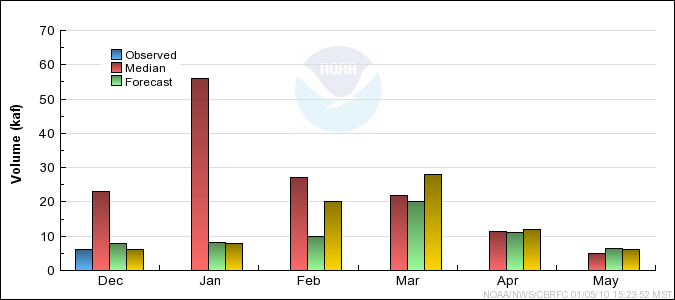
Salt Basin Conditions
January through May runoff volumes in the Salt River Basin are expected to range from near
to slightly above median. December precipitation ranged from 200 to 300 percent of average
with significant snow falling at higher elevations. Snowpack in the upper Salt, Verde, and
Tonto River Basins has reached levels as high as 320 percent of average, exceeding average
seasonal peaks at many locations. December streamflow in the Salt River Basin exceeded 400
percent of the median.
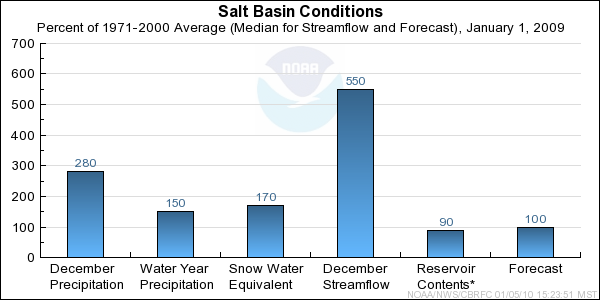
* Percent usable capacity, not percent average contents.
Click for multi-month Graph.
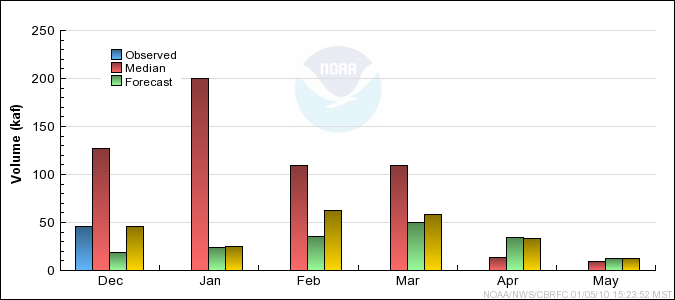
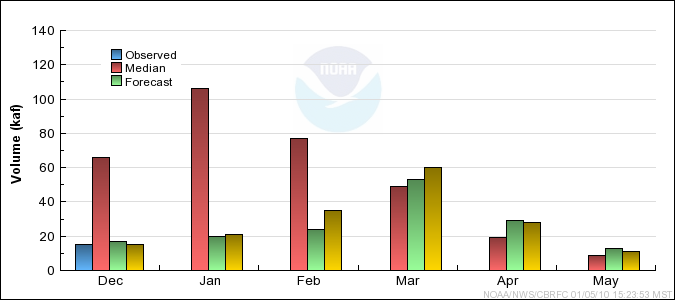
Gila Basin Conditions
January through May runoff volumes in the Gila River Basin are expected to range from 80 to
105 percent of median. December precipitation ranged from 65 to 200 percent of median at most
locations while December streamflow was generally between 80 and 110 percent of median.
Snowpack, while not a large contributor to seasonal runoff in much of the Gila Basin, is
between 60 to 125 percent of average.
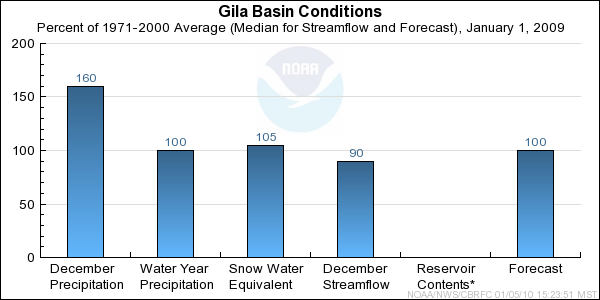
* Percent usable capacity, not percent average contents.
Click for multi-month Graph.
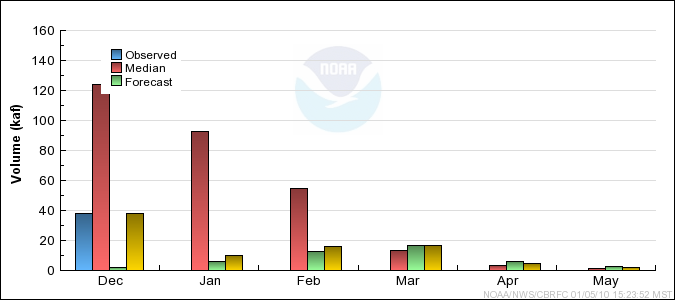
Little Colorado Basin Conditions
January through May runoff volumes in the Little Colorado Basin are expected to range from
near median to 150 percent of median. Smaller, high elevation streams, that draw more runoff from
snow melt, are forecast to exceed median values by the greatest amounts. December precipitation
ranged from 150 to over 300 percent of average in the Little Colorado with much of it falling as snow
above 7500 feet. Snowpack in the Little Colorado headwaters exceeds average annual peaks
and ranges from 200 to 280 percent of average. December streamflows in the Little Colorado were near
90 percent of median.
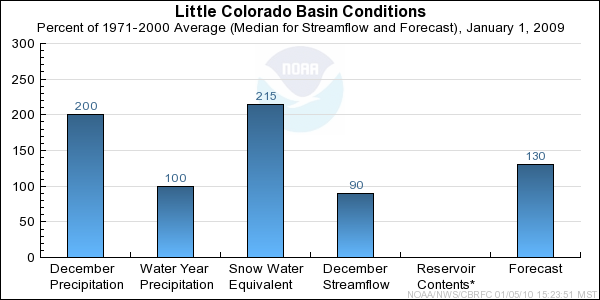
* Percent usable capacity, not percent average contents.
Click for multi-month Graph.
Differences between the full period forecasts and the residual forecasts may not exactly equal the actual observed volumes due to rounding conventions (see Definitions section).
Monthly Streamflows
Precipitation Maps
Hydrologist: G. Smith
