Note: This publication is currently undergoing major revisions. The current publication will be replaced with a new publication based on stakeholder requirements and scientific advances. We expect to begin sharing details on this soon. If you have input on content, format, or publication frequency at any time, please contact us at cbrfc.webmasters@noaa.gov.Lower Colorado Water Supply Outlook, January 1, 2010Lower Colorado Water Supply Outlook, January 1, 2010
Contents
Lower Colorado Summary
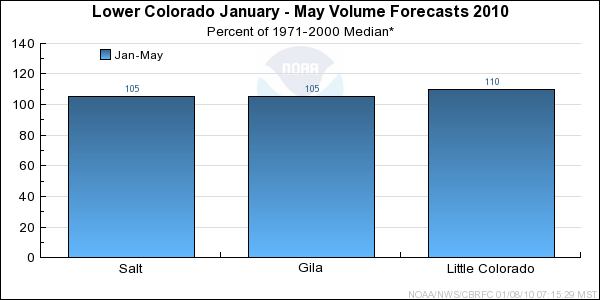
*Median of forecasts within each basin.
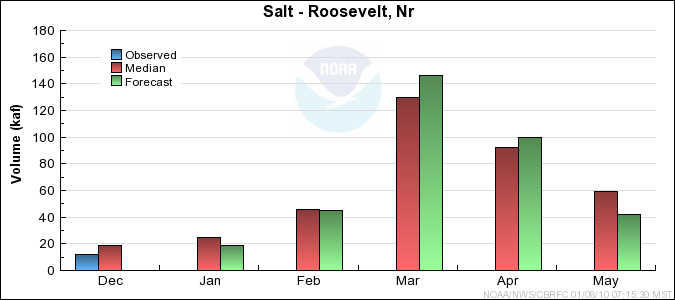
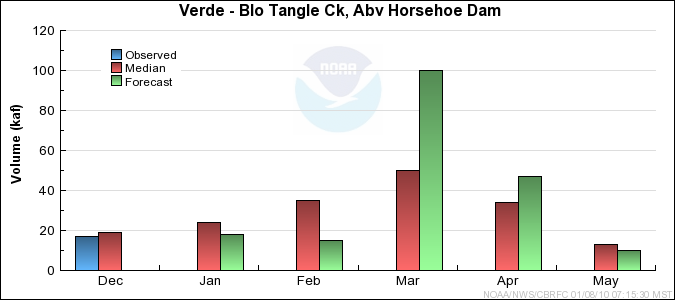
Salt Basin Conditions
The following conditions influenced this month's forecasts:
Precipitation:
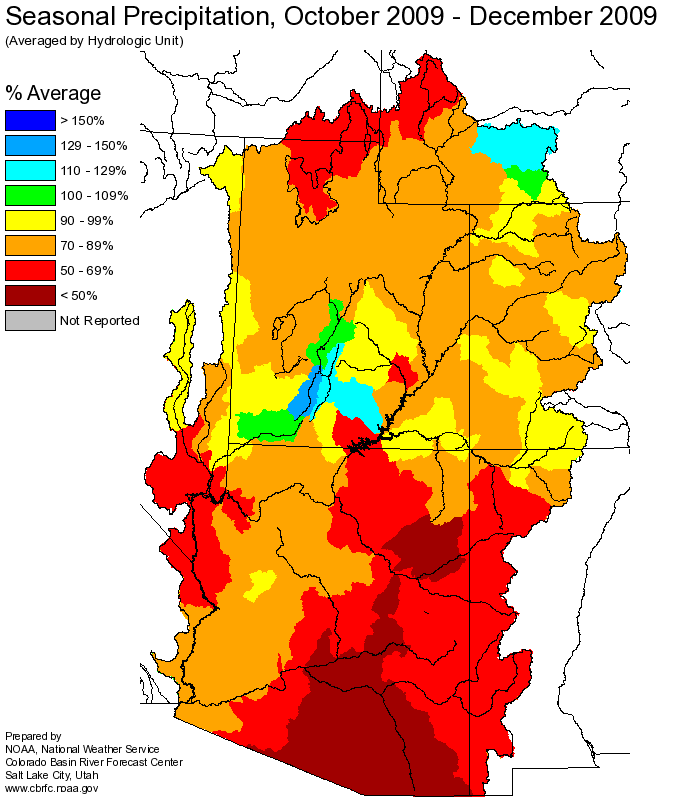
Seasonal October-December
precipitation was near 60 percent of average.
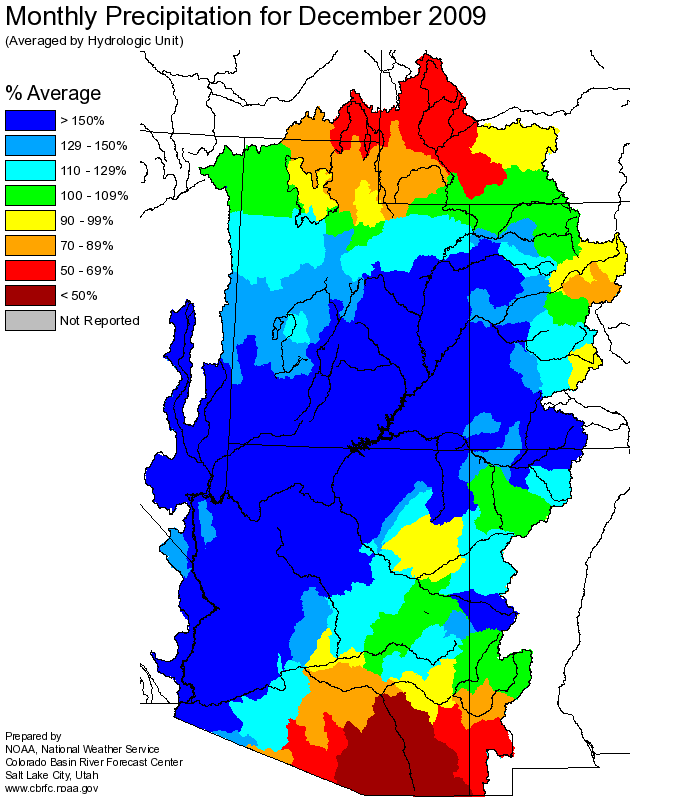
December
precipitation was 125 percent of average in the Salt Basin, and near 150 percent in the Verde Basin.
Streamflow:
December streamflow ranged from 60 to 90 percent of median.
Snow:
January 1st snowpack conditions were 210 percent of average in the Verde Basin and
110 percent of average in the upper Salt.
Salt River Basin
Snow Plot.
Verde River Basin
Snow Plot.
Soil Moisture:
Modeled soil moisture states were drier compared to this time last year.
Climate Forecasts:
El Nino climate conditions suggest increased chances for precipitation in this area.
The El Nino influence was accounted for in generation of these forecasts.
Forecast Summary:
Despite below average seasonal precipitation and drier soils, the presence of El Nino climate conditions combined
with above average snowpack resulted in January-May volume forecasts between 90 and 110 percent
of median.
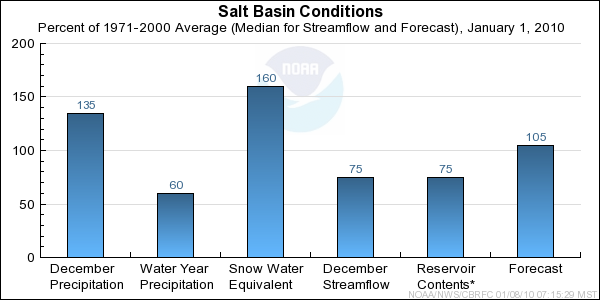
* Percent usable capacity, not percent average contents.
Click for multi-month Graph.
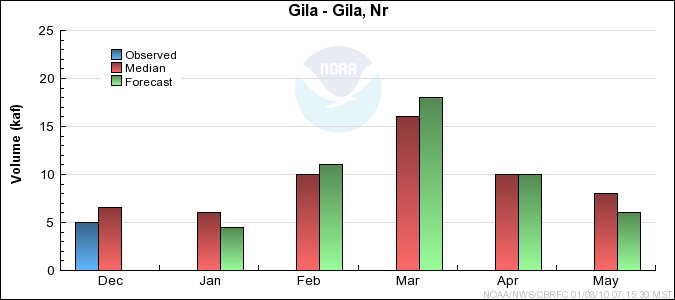
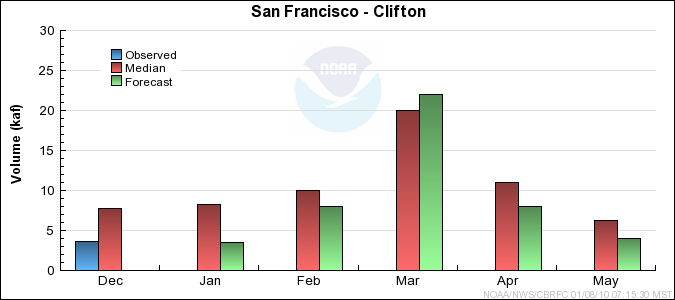
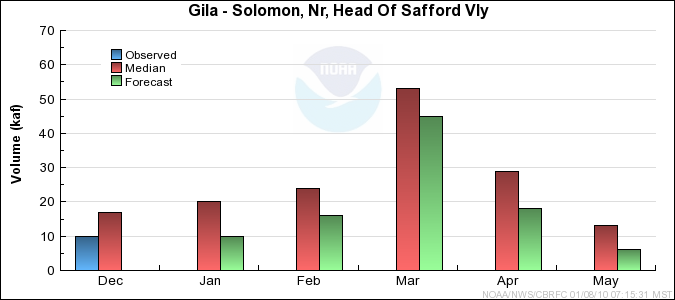
Gila Basin Conditions
The following conditions influenced this month's forecasts:
Precipitation:
Seasonal October-December
precipitation was near 60 percent of average.
December
precipitation ranged from 80 to 100 percent of average.
Streamflow:
December streamflow ranged from 45 to 75 percent of median.
Snow:
Basin snowpack conditions were near average as of January 1st.
Upper Gila Basin
Snow Plot.
San Francisco Basin
Snow Plot
Soil Moisture:
Modeled soil moisture states were wetter in the San Francisco drainage, but vary
in comparsion to last year in the upper Gila Basin.
Climate Forecasts:
El Nino climate conditions suggest increased chances for precipitation in this area.
The El Nino influence was accounted for in generation of these forecasts.
Forecast Summary:
Below average seasonal precipitation and below median streamflow in December
support forecast volumes much lower than those indicated. Significant weight
was placed on the El Nino climate condition, and a wetter pattern developing.
This resulted in January-May forecast volumes between 90 and 110 percent of
median.
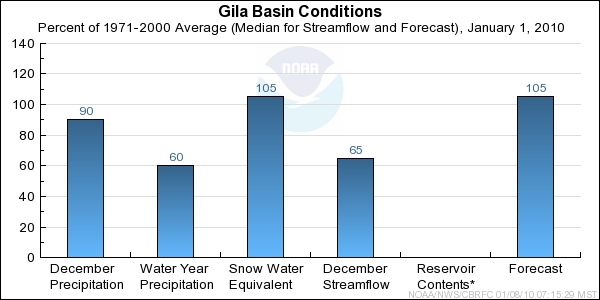
* Percent usable capacity, not percent average contents.
Click for multi-month Graph.
Little Colorado Basin Conditions
The following conditions influenced this month's forecasts:
Precipitation:
Seasonal October-December
precipitation was near 50 percent of average.
December
precipitation ranged from 70 to 145 percent of average.
Streamflow:
December streamflow was near 30 percent (or less) of median.
Snow:
Basin snowpack conditions were near 130 percent of average in the southern Headwaters.
Little Colorado Southern Headwaters
Snow Plot
Central Mogollon Rim
Snow Plot
Soil Moisture:
Modeled soil moisture states were slightly drier compared to this time last year.
Climate Forecasts:
El Nino climate conditions suggest increased chances for precipitation in this area.
The El Nino influence was accounted for in generation of these forecasts.
Forecast Summary:
Below average seasonal precipitation and below median streamflow in December
support forecast volumes much lower than those indicated. Significant weight
was placed on the El Nino climate condition, and a wetter pattern developing.
The El Nino influence combined with an above average snowpack resulted in January-May
forecast volumes between 100 and 125 percent of median
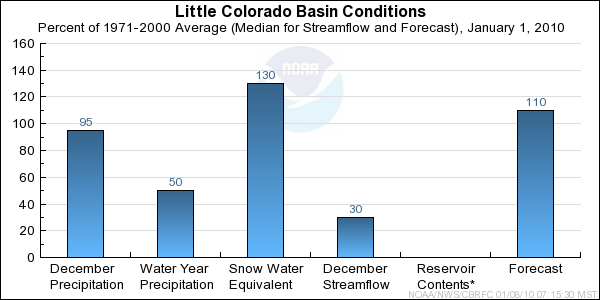
* Percent usable capacity, not percent average contents.
Click for multi-month Graph.
Differences between the full period forecasts and the residual forecasts may not exactly equal the actual observed volumes due to rounding conventions (see Definitions section).
Monthly Streamflows

Precipitation Maps
Hydrologist: G. Smith
