NOAA, National Weather Service
Colorado Basin River Forecast Center
Salt Lake City, Utah
www.cbrfc.noaa.gov
| Prepared by G. Smith NOAA, National Weather Service Colorado Basin River Forecast Center Salt Lake City, Utah www.cbrfc.noaa.gov |

| Forecast Period | 90% Exceedance Volume | 50% Exceedance Volume | Percent Median | 10% Exceedance Volume | |
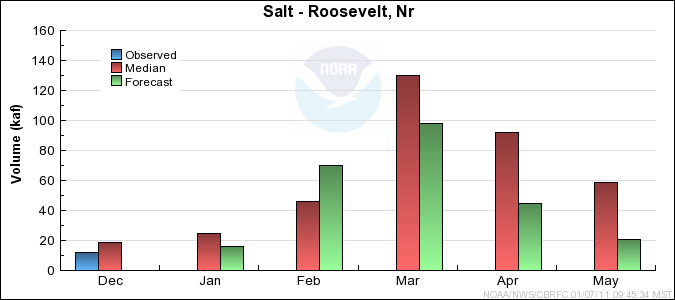
| Salt | |||||
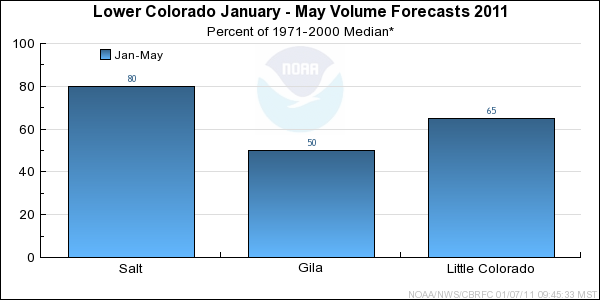
| Roosevelt, Nr | January-May | 94 | 250 | 65 | 525 |
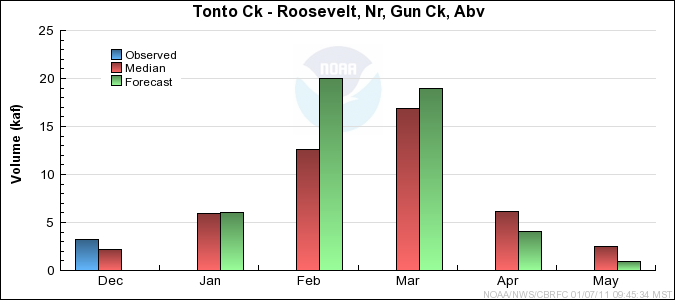
| Tonto Ck | |||||
| Roosevelt, Nr, Gun Ck, Abv | January-May | 8.4 | 50 | 89 | 152 |
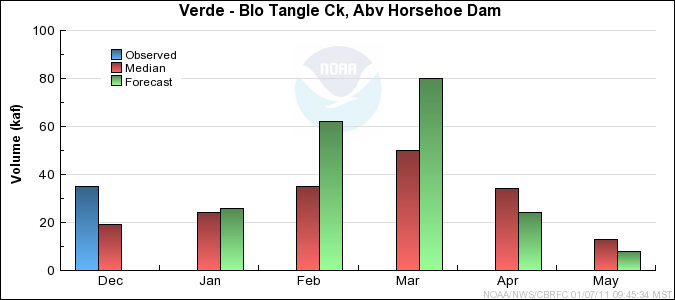
| Verde | |||||
| Blo Tangle Ck, Abv Horsehoe Dam | January-May | 70 | 200 | 91 | 435 |
| Forecast Period | 90% Exceedance Volume | 50% Exceedance Volume | Percent Median | 10% Exceedance Volume | |
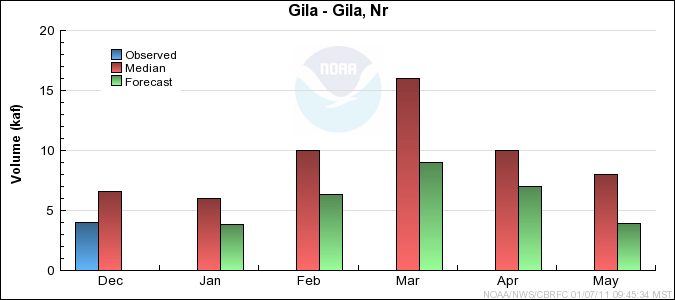
| Gila | |||||
| Gila, Nr | January-May | 15 | 35 | 58 | 81 |
| Virden, Nr, Blue Ck, Blo | January-May | 16 | 38 | 46 | 126 |
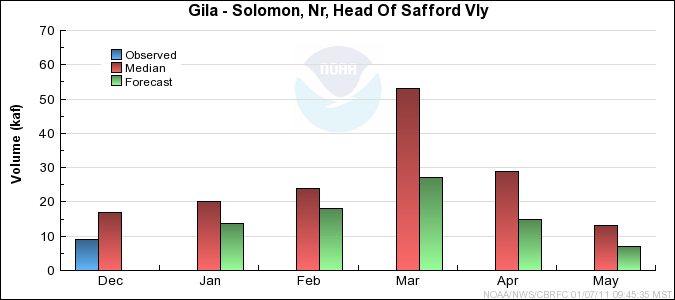
| Solomon, Nr, Head Of Safford Vly | January-May | 32 | 95 | 58 | 280 |
| San Carlos Res, Coolidge Dam, At | January-May | 21 | 52 | 54 | 270 |
| San Francisco | |||||
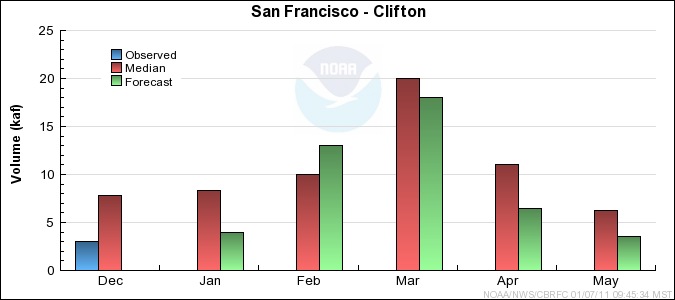
| Glenwood, Nr | January-May | 5 | 18 | 67 | 53 |
| Clifton | January-May | 16 | 45 | 64 | 106 |
| Forecast Period | 90% Exceedance Volume | 50% Exceedance Volume | Percent Median | 10% Exceedance Volume | |
| Little Colorado | |||||
| Lyman Lk, Abv, St. Johns, Nr | January-June | 1.7 | 6 | 81 | 14.5 |
| Woodruff | January-May | 0.4 | 3 | 83 | 30 |
| Rio Nutria | |||||
| Ramah, Nr | January-May | 0.14 | 1.8 | 58 | 7 |
| Zuni | |||||
| Black Rock Res, Abv | January-May | 0.37 | 0.9 | 61 | 3 |
| Cebolla Ck | |||||
| Ramah Res | January-May | 0.03 | 1 | 58 | 3.3 |
| East Clear Ck | |||||
| Blue Ridge Res, Pine, Nr | January-May | 2.7 | 11 | 64 | 29 |
| Clear Ck | |||||
| Winslow, Nr | January-May | 6.7 | 24 | 71 | 116 |
| Chevelon Ck | |||||
| Winslow, Nr, Wildcat Cyn, Blo | January-May | 3.5 | 13 | 74 | 60 |
| Walnut Ck | |||||
| Lake Mary | January-May | 1 | 3.7 | 74 | 9.1 |
| Usable Capacity | EOM Contents | Percent Usable Capacity | Last Year EOM | Last Year %Capacity | |
| Salt | |||||
| Roosevelt | 1653.0 | 1485.3 | 90 | 1254.0 | 76 |
| Horse Mesa | 245.0 | 228.1 | 93 | 218.2 | 89 |
| Mormon Flat | 58.0 | 55.6 | 96 | 55.9 | 96 |
| Stewart Mountain | 70.0 | 67.7 | 97 | 66.2 | 95 |
| Horseshoe | 109.2 | 38.7 | 35 | 22.3 | 20 |
| Bartlett | 178.0 | 112.3 | 63 | 69.9 | 39 |
|
| |||||
| TOTAL | 2313.2 | 1987.6 | 86 | 1686.6 | 73 |
| Little Colorado | |||||
| Lyman Lake | 31.0 | 19.8 | 64 | 12.2 | 39 |
| Bill Williams | |||||
| Alamo | 1045.0 | 137.0 | 13 | 123.7 | 12 |
| Agua Fria | |||||
| Lake Pleasant | 1145.0 | 696.2 | 61 | 560.2 | 49 |
| Gila | |||||
| San Carlos | 885.0 | 110.9 | 13 | 240.5 | 27 |
| Painted Rock | 2476.0 | 0.0 | 0 | 0.0 | 0 |
| Colorado | |||||
| Lake Powell | 24322.0 | 14469.0 | 59 | 14433.8 | 59 |
| Lake Mead | 27380.0 | 10302.0 | 38 | 11169.0 | 41 |
| Lake Mohave | 1810.0 | 1665.5 | 92 | 1587.6 | 88 |
| Lake Havasu | 619.0 | 578.3 | 93 | 565.4 | 91 |
|
| |||||
| TOTAL | 59713.0 | 27978.7 | 47 | 28692.4 | 48 |
| Range | Round to | |
| 0-1.99 | 0.01 | |
| 2.0-19.9 | 0.1 | |
| 20-199 | 1.0 | |
| 200-999 | 5.0 | |
| 1000+ | 3 significant digits |