Note: This publication is currently undergoing major revisions. The current publication will be replaced with a new publication based on stakeholder requirements and scientific advances. We expect to begin sharing details on this soon. If you have input on content, format, or publication frequency at any time, please contact us at cbrfc.webmasters@noaa.gov.Lower Colorado Water Supply Outlook, February 1, 2009Lower Colorado Water Supply Outlook, February 1, 2009
Contents
Lower Colorado Summary
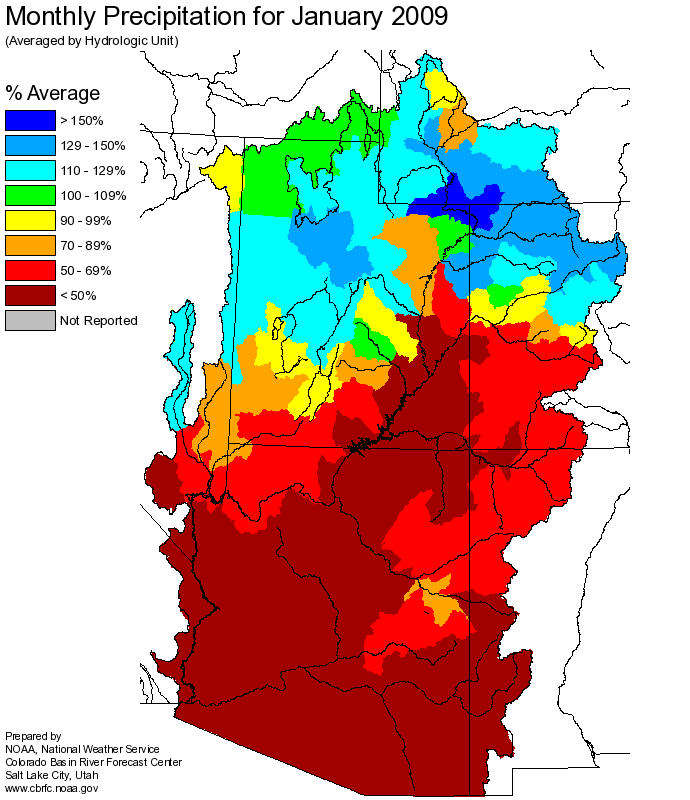
Precipitation in January was much below average across all of the Lower Colorado River
Basin. Snowmelt also occurred in many locations, particularly at elevations up to 7500 feet.
Snowpack conditions remain above average across most higher elevations with the exception
of the Gila Basin where it is 70 percent of average or less. Streamflow during January was
much above median in the Salt River Basin due to a combination of snow melt and precipitation
that occurred later in the month. Elsewhere streamflow volumes were near to below median.
An active weather pattern bringing preciptation to Arizona is anticipated the first
half of February. As a result February streamflow volumes are forecast to meet or
exceed median levels. Seasonal volume forecasts vary widely, with near to above median volumes
expected in the Little Colorado Basin, near to slightly below median values expected in the
Salt River Basin, and below median values expected in the Gila Basin. Weak La Nina
conditions are forecast to extend into the spring months. La Nina usually correlates
with drier weather conditions across the Lower Colorado River Basin region.

*Median of forecasts within each basin.
Salt Basin Conditions
Precipitation for the month of January was near 40 percent of average in the Salt
River Basin. February 1st snowpack ranged from near 115 to 140 percent of average in
the higher elevations. Precipitation combined with low and mid elevation snowmelt during
the last week of January and resulted in monthly streamflow volumes that ranged from
140 to 220 percent of median.
The runoff response from the late January precipitation and melt was indicative of moist soil
conditions. Efficient runoff is anticipated from future precipitation events that may occur for
the next several weeks. With additional precipitation expected during the first half of February, monthly volumes are forecast to exceed
median values. Seasonal forecast volumes for February through May range from 80 to 95 percent of
median.

* Percent usable capacity, not percent average contents.
Click for multi-month Graph.
Gila Basin Conditions
Precipitation in the Upper Gila Basin during January was near 35 percent of average. Snowpack
conditions decreased from 180 percent of average on January 1st to 60 percent of average on
February 1st. Streamflow conditions in January were near median in the Gila Basin headwaters,
and ranged from 65 to 85 percent of median in the San Francisco drainage and elsewhere.
Seasonal streamflow volumes for February through May are expected to range from 60 to 80
percent of median across most of the upper Gila River Basin.

* Percent usable capacity, not percent average contents.
Click for multi-month Graph.
Little Colorado Basin Conditions
January precipitation ranged from near 40 to 70 percent of average in the Little Colorado Basin.
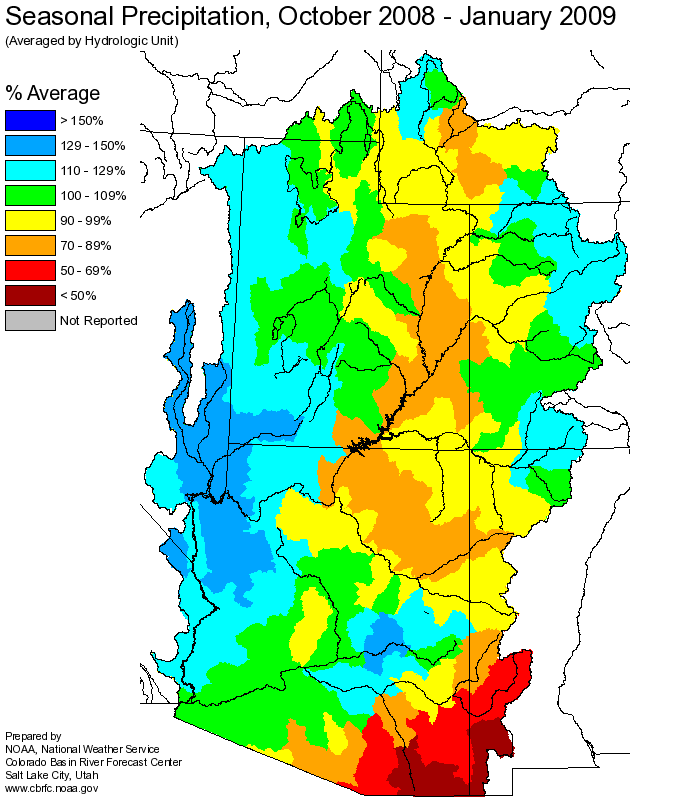
Seasonal precipitation varies from near 70 percent of average at lower elevations to over
110 percent of average at higher elevation headwater sites where snowpack exists. While snowpack
expressed as a percent of average decreased over the last month, the actual snowpack increased slightly.
Current snowpack in the Little Colorado headwaters is near 150 percent of average. February through May
runoff volumes in the Little Colorado Basin are expected to range from near median to 130 percent of
median. Smaller, high elevation streams, that draw more runoff directly from snow melt, are forecast
to exceed median values by the greatest amounts.

* Percent usable capacity, not percent average contents.
Click for multi-month Graph.
Differences between the full period forecasts and the residual forecasts may not exactly equal the actual observed volumes due to rounding conventions (see Definitions section).
Monthly Streamflows


Precipitation Maps
Hydrologist: G. Smith
