Note: This publication is currently undergoing major revisions. The current publication will be replaced with a new publication based on stakeholder requirements and scientific advances. We expect to begin sharing details on this soon. If you have input on content, format, or publication frequency at any time, please contact us at cbrfc.webmasters@noaa.gov.Lower Colorado Water Supply Outlook, March 1, 2009

Lower Colorado Water Supply Outlook, March 1, 2009


Prepared by G. Smith
NOAA, National Weather Service
Colorado Basin River Forecast Center
Salt Lake City, Utah
www.cbrfc.noaa.gov

Contents

Lower Colorado Summary

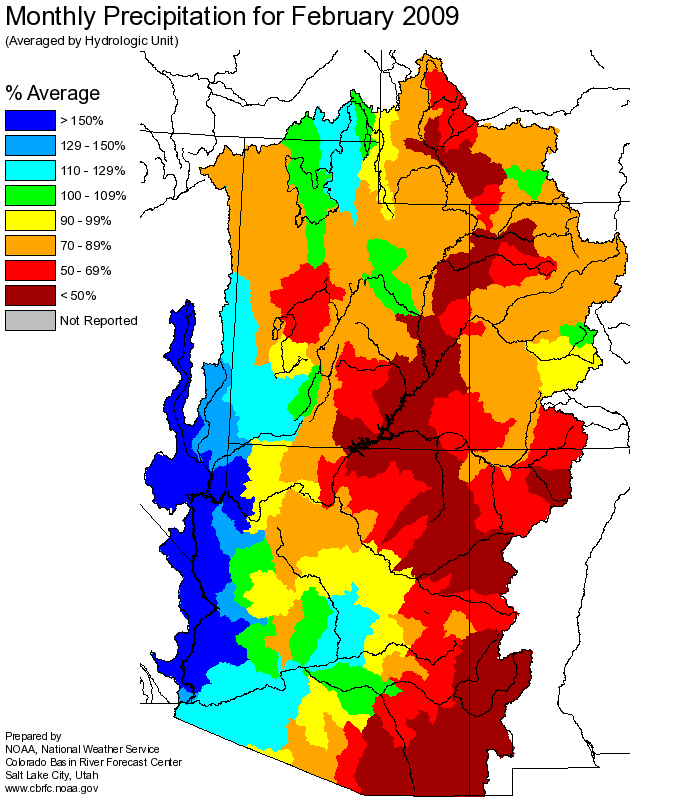
Below average precipitation occurred over much of the Lower Colorado region with the exception of the middle and lower Salt River Basin, and extreme western Arizona during February. Very warm temperatures during the latter half of the month resulted in a loss of snowpack below 9000 feet which increased streamflow volumes in the Verde, Salt, Tonto, and Little Colorado drainages. No significant precipitation events are anticipated during the first part of March in the Lower Colorado Basin with the period beyond March climatologically drier than the winter period. Seasonal streamflow volumes are generally expected to be below median for the March through May period.


*Median of forecasts within each basin.


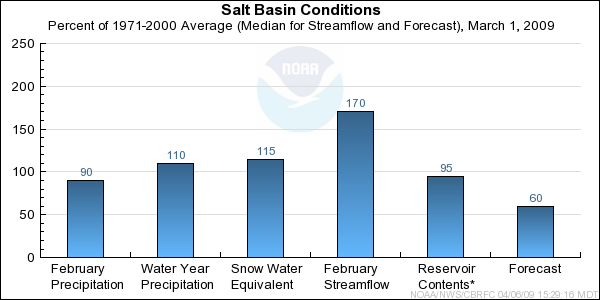
Salt Basin Conditions

Model Soil Moisture/Observed Streamflow - Streamflow in February ranged from near 120 percent 
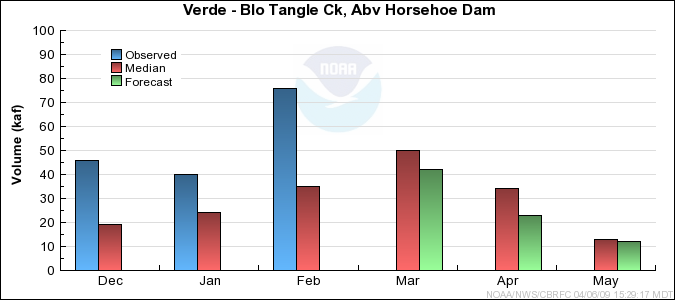
of median on the Salt River to near 215 percent of median on the Verde mainstem. Lower elevation snow melt contributed to the streamflow volumes and river responses were indicative of moist soil conditions in this area.

Snowpack/Precipitation - Below to near average precipitation occurred during February in the upper Salt River Basin with near to slightly above average precipitation in the Tonto and Verde Basins. 
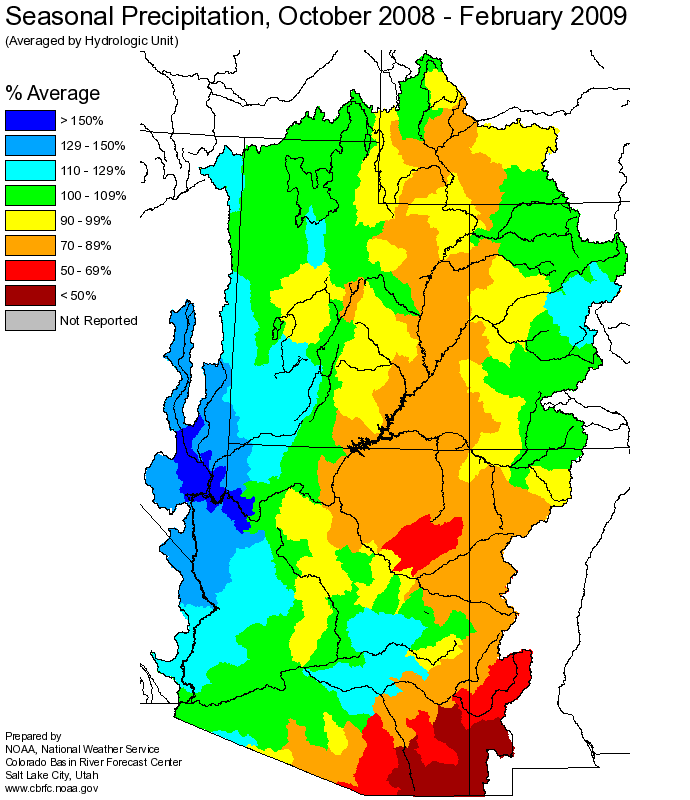
Seasonal precipitation, October through February, was near to above average. Snowpack conditions as of March 1st were quite variable in the Verde, Tonto, and Upper Salt River drainages and ranged from near 50 to 160 percent of average at individual measuring sites.

General Discussion/Forecasts - Near record warm temperatures during the latter half of February resulted in enhanced snowmelt and a reduction in the areal coverage of the snowpack. Snowmelt is expected to contribute to above median flows on the Salt River through the first two weeks of March. Elsewhere only a minimal contribution to streamflow volumes is expected from the remaining snow. 
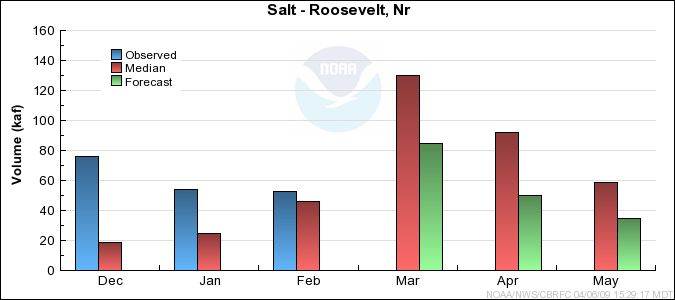
Seasonal forecast volumes for the March through May period range from 60 to 85 percent of median.


* Percent usable capacity, not percent average contents.
Click for multi-month Graph.

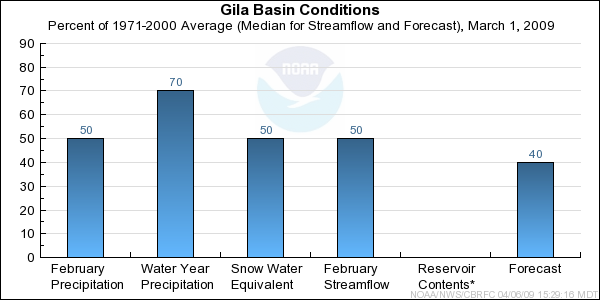
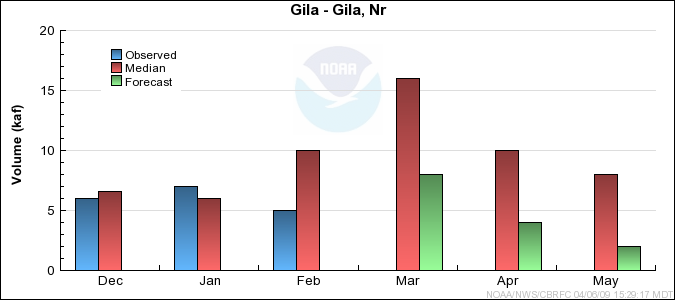
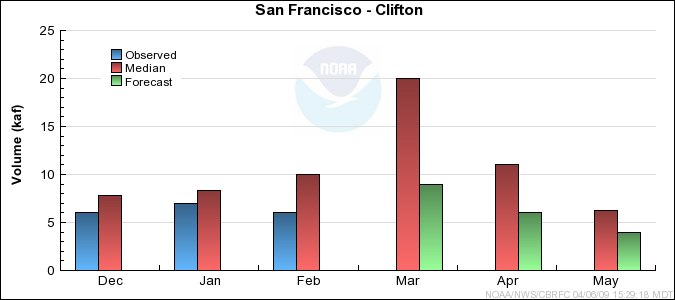
Gila Basin Conditions

Model Soil Moisture/Observed Streamflow - Streamflow volumes for February in the upper Gila River Basin were near 50 percent of median. Seasonal flows dating back to October have also been below median and in combination with below average precipitation suggest soil moisture deficits exist in this area.

Snowpack/Precipitation - Precipitation in the upper Gila Basin was much below average for February. With the exception of December, monthly precipitation has been below average each month dating back to October of 2008. Seasonal October through February precipitation was near 70 percent of average. Snowpack in the Gila Basin has been depleted with minimal amounts remaining at highest elevations.

General Discussion/Forecasts - Seasonal volume forecasts in the Gila Basin reflect the dry conditions that exist in the Basin. March through May runoff volumes are forecast to range between 30 and 45 percent of median.


* Percent usable capacity, not percent average contents.
Click for multi-month Graph.

Little Colorado Basin Conditions

Model Soil Moisture/Observed Streamflow - Streamflow volumes for February varied quite dramatically in the Little Colorado tributaries due to snowmelt below 9000 feet. Some small higher elevation streams experienced volumes in excess of 100 percent of median while mainstem Little Colorado volumes were in the 60 to 90 percent of median range.

Snowpack/Precipitation - Precipitation in the Little Colorado drainage was near 65 percent of average for February. Seasonal precipitation for October through February ranged from 85 to 100 percent of average in middle sections of the Little Colorado Basin extending south toward the Mogollon Rim. Eastern headwater areas have been much drier with seasonal precipitation values from 50 to 70 percent of average. The areal extent of snow cover decreased over the past month with snow remaining only at the highest elevations. Snowpack in these areas is near average for this time of year.

General Discussion/Forecasts - Seasonal streamflow volumes are forecast to range from near 25 to 80 percent of median during the March through May period. Lowest volumes, with respect to median, are anticipated from the extreme eastern part of the Little Colorado Basin. Volumes closer to median are more likely in those drainages where snowpack remains.


* Percent usable capacity, not percent average contents.
Click for multi-month Graph.


Salt Specific Site Forecasts (kaf)

Click site name for graph.
Forecast
Period
90%
Exceedance
Volume
50%
Exceedance
Volume
Percent
Median
10%
Exceedance
Volume
Salt
Roosevelt, Nr March-May7517063320
Tonto Ck
Roosevelt, Nr, Gun Ck, Abv March-May2155849
Verde
Blo Tangle Ck, Abv Horsehoe Dam March-May357753175


Gila Specific Site Forecasts (kaf)

Click site name for graph.
Forecast
Period
90%
Exceedance
Volume
50%
Exceedance
Volume
Percent
Median
10%
Exceedance
Volume
Gila
Gila, Nr March-May5.8144128
Virden, Nr, Blue Ck, Blo March-May7132846
Solomon, Nr, Head Of Safford Vly March-May143533127
San Carlos Res, Coolidge Dam, At March-May5203181
San Francisco
Glenwood, Nr March-May1.874317.7
Clifton March-May7.6194548
San Pedro
Charleston March-May0.10.9452.4


Little Colorado Specific Site Forecasts (kaf)

Click site name for graph.
Forecast
Period
90%
Exceedance
Volume
50%
Exceedance
Volume
Percent
Median
10%
Exceedance
Volume
Little Colorado
Lyman Lk, Abv, St. Johns, Nr March-June1.657911.5
Woodruff March-May0.11459
Rio Nutria
Ramah, Nr March-May0.191.9706.9
Zuni
Black Rock Res, Abv March-May0.010.2220.59
Cebolla Ck
Ramah Res March-May0.21673.9
East Clear Ck
Blue Ridge Res, Pine, Nr March-May3.286316
Clear Ck
Winslow, Nr March-May4206553
Chevelon Ck
Winslow, Nr, Wildcat Cyn, Blo March-May1.286116
Walnut Ck
Lake Mary March-May0.912.6635.6

Differences between the full period forecasts and the residual forecasts may not exactly equal the actual observed volumes due to rounding conventions (see Definitions section).

Lower Colorado Reservoir Contents (kaf)

Usable
Capacity
EOM
Contents
Percent
Usable
Capacity
Last Year
EOM
Last Year
%Capacity
Salt
Roosevelt 1653.0 1653.0 100 1452.5 88
Horse Mesa 245.0 240.4 98 239.2 98
Mormon Flat 58.0 56.2 97 55.3 95
Stewart Mountain 70.0 66.7 95 67.8 97
Horseshoe 109.2 62.2 57 106.4 97
Bartlett 178.0 141.3 79 175.1 98
untitled
TOTAL 2313.2 2219.9 96 2096.3 91
Little Colorado
Lyman Lake 31.0 14.5 47 9.7 31
Bill Williams
Alamo 1045.0 162.3 16 164.0 16
Agua Fria
Lake Pleasant 1145.0 697.0 61 750.9 66
Gila
San Carlos 885.0 227.8 26 358.8 41
Painted Rock 2476.0 0.0 0 0.0 0
Colorado
Lake Powell 24322.0 12937.8 53 10880.4 45
Lake Mead 27380.0 12533.0 46 13060.0 48
Lake Mohave 1810.0 1675.2 93 1599.9 88
Lake Havasu 619.0 541.8 88 547.9 89
untitled
TOTAL 59713.0 28789.4 48 27371.5 46

Monthly Streamflows


Precipitation Maps


Definitions

10% exceedance forecast: Given the current hydrometeorological conditions, i.e current snowpack, soil moisture and streamflow, the volume that has a 10% chance of being exceeded. Previously referred to as "Reasonable Maximum Forecast".

50% exceedance forecast: Given the current hydrometeorological conditions, i.e current snowpack, soil moisture and streamflow, the volume that has a 50% chance of being exceeded. Previously referred to as "Most Probable Forecast".

90% exceedance forecast: Given the current hydrometeorological conditions, i.e current snowpack, soil moisture and streamflow, the volume that has a 90% chance of being exceeded. Previously referred to as "Reasonable Minimum Forecast".

Acre-Foot (af): The volume equal to one acre covered one foot deep (43,560 cubic feet). See kaf below.

Average: The arithmetic mean. The sum of the values divided by the number of values. Values from 1971-2000 are used for this publication.

Categories: Much Above Average=Greater than 130%, Above Average=111-130%, Near Average=90-110%, Below Average=70-89%, Much Below Average=Less than 70%.

CBRFC: Colorado Basin River Forecast Center.

Forecast Period: The period from April 1 through July 31, unless otherwise noted.

kaf: Thousand Acre-Feet. See Acre-Foot above.

Inflow: The volume of water that flows into a reservoir or lake.

Median: The middle value of an ordered set of values. Half of the values are higher and half of the values are lower. When the set contains an even number of values the median is the average of the two middle numbers.

NOAA: National Oceanic and Atomospheric Administration.

NWS: National Weather Service.

Rounding Conventions:
RangeRound to
0-1.990.01
2.0-19.90.1
20-1991.0
200-9995.0
1000+3 significant digits


Streamflow: The volume of water that flows past a specific stream site.

Water Year: The 12-month period, October 1 through September 30. The water year is designated by the calendar year in which it ends. Thus, the year ending September 30, 2008, is called the "2008 water year."


Additional Information

Water supply forecasts take into consideration present hydrometeorological conditions and use average basin temperatures and precipitation for the forecast period. As the forecast season progresses, a greater portion of the future hydrologic and climatic uncertainty becomes known and monthly forecasts become more accurate. For more information on the tools we use, consult Water Supply Forecasting Tools.

Volume forecasts represent adjusted flows; that is, observed flows with upstream water use taken into account. Adjusted flows will closely approximate natural or unimpaired flows. However, not all upstream diversions or impoundments are measured or quantifiable. For specific adjustments used with each forecast point, consult the Guide to Water Supply Forecasting.

The Water Supply Outlook is issued monthly January through May by the Colorado Basin River Forecast Center. It represents a coordinated effort between the National Weather Service, Natural Resources Conservation Service, Bureau of Reclamation, U.S. Geological Survey and local water district managers.

Note: Data used in this report are provisional and are subject to revision.

For more information, or to be included on the mailing list, please contact:

Colorado Basin River Forecast Center
2242 W North Temple
Salt Lake City, UT 84116
(801) 524-5130
www.cbrfc.noaa.gov


Hydrologist: G. Smith