Note: This publication is currently undergoing major revisions. The current publication will be replaced with a new publication based on stakeholder requirements and scientific advances. We expect to begin sharing details on this soon. If you have input on content, format, or publication frequency at any time, please contact us at cbrfc.webmasters@noaa.gov.Lower Colorado Water Supply Outlook, April 1, 2009Lower Colorado Water Supply Outlook, April 1, 2009
Contents
Lower Colorado Summary
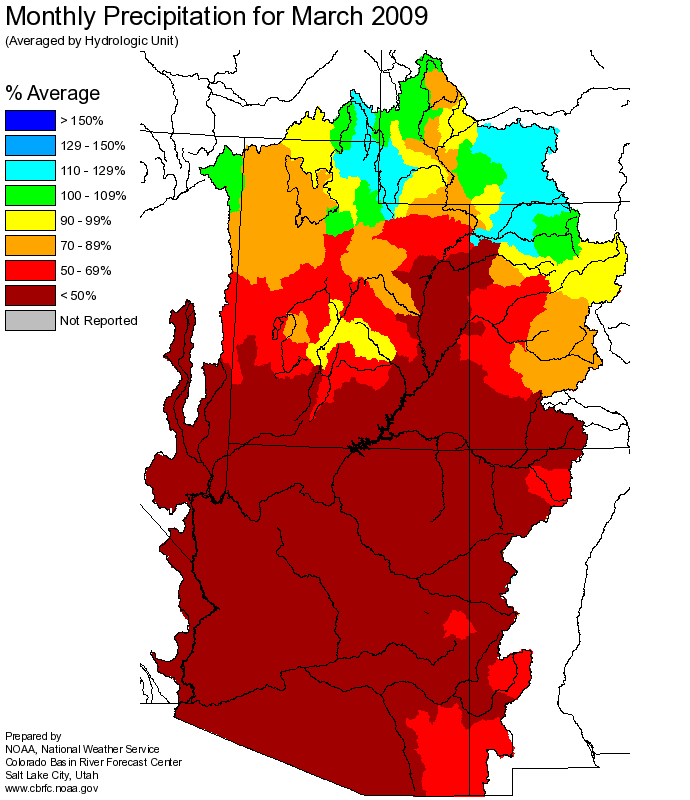
Dry conditions persisted through March with much of Arizona receiving monthly precipitation
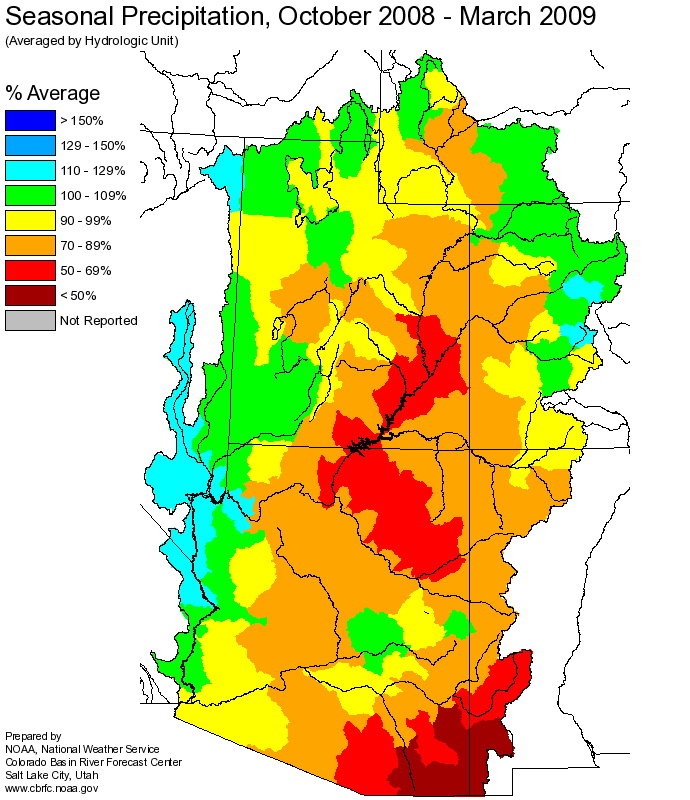
amounts between 10 and 45 percent of average. Seasonal precipitation remains near average in
the Salt River Basin and along the western Arizona border, primarily due to a wet December.
Elsewhere, seasonal precipitation has dropped to below average levels. Snowpack in Arizona
remains only at highest elevations, with future melt contributing little to seasonal
volumes. Streamflow was above average in the Little Colorado in March due to snow melt.
Elsewhere throughout Arizona March streamflow volumes were below average.
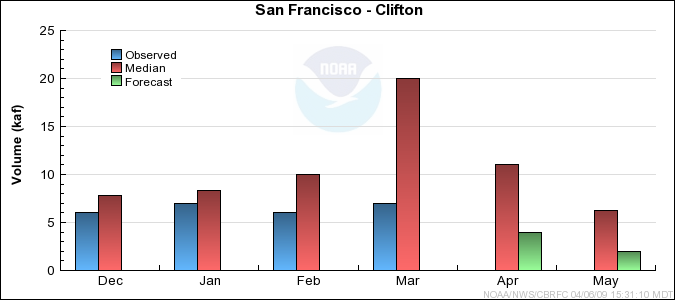
Streams are in recession from the winter season, or already near baseflow. April-May is
climatologically a drier period and typically streamflows do not increase much prior to the summer
monsoon. Volumetric forecasts for the April-May period are expected to range from near 20 to 50
percent of median.
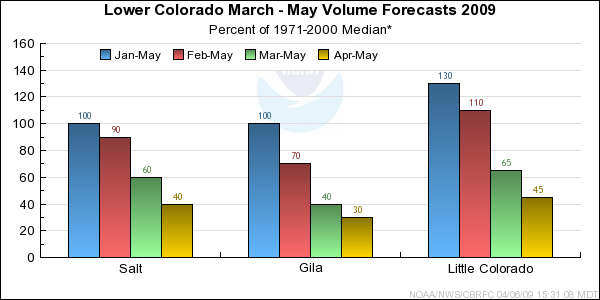
*Median of forecasts within each basin.
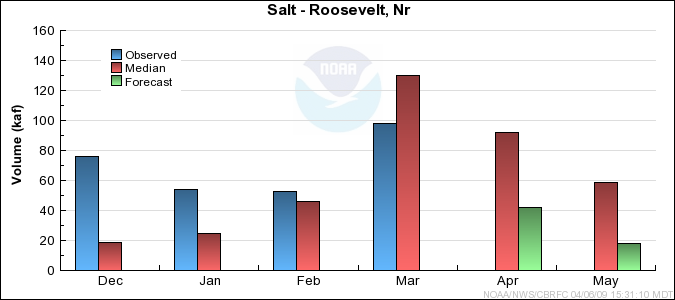
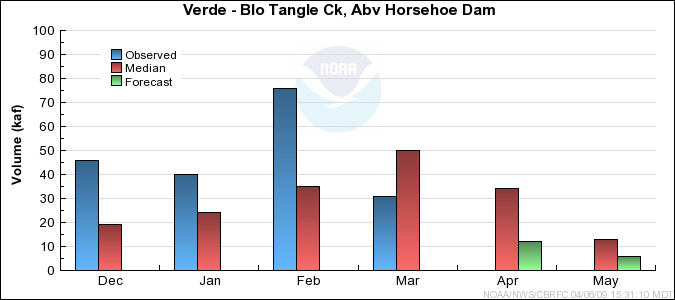
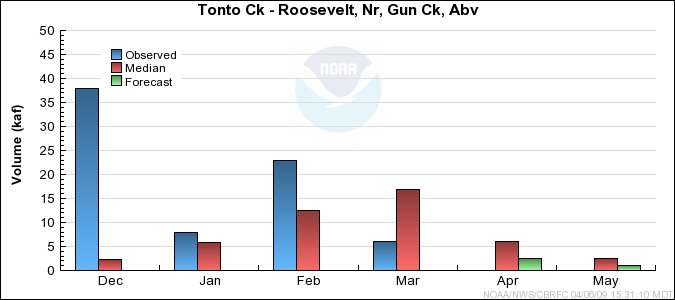
Salt Basin Conditions
Model Soil Moisture/Observed Streamflow - Streamflow volumes in March were below average for the
first time this winter. Some streams are flowing near baseflow at this time.
Snowpack/Precipitation - March precipitation amounts ranged from near 10 to 35 percent of average
in the Salt, Verde, and Tonto Basins. Seasonal precipitation is near average. Only minimal snowpack
remains at highest elevations of the Salt River Basin and is not a significant factor contributing to
runoff expectations.
General Discussion/Forecasts - April-May is climatologically a drier period in Arizona prior to
the summer monsoon. Streams are forecast to continue their recession or remain near their baseflow
conditions. April-May volumes in the Salt, Verde, Tonto streams are forecast to be near 40 percent
of median.
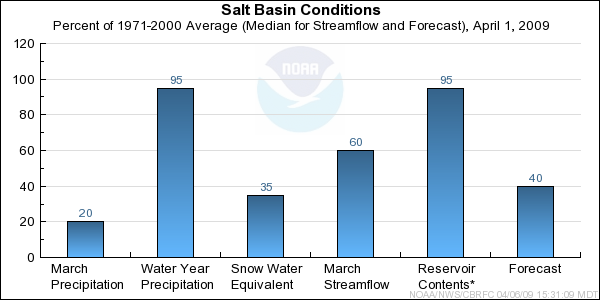
* Percent usable capacity, not percent average contents.
Click for multi-month Graph.
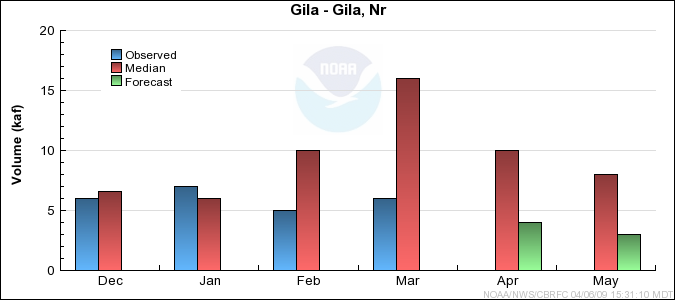
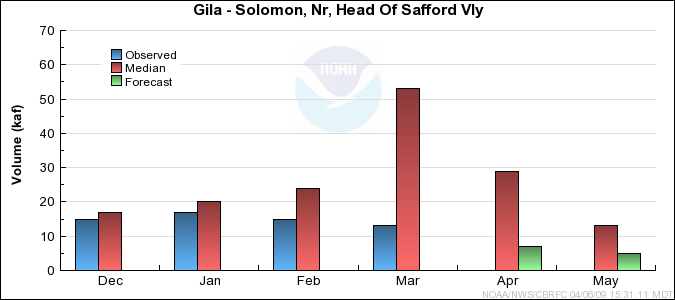
Gila Basin Conditions
Model Soil Moisture/Observed Streamflow - Streamflow volumes in March in the Gila Basin ranged from
near 20 to 40 percent of median. Several months of below average streamflow combined with below average
precipitation suggest soil moisture deficits exist in this area.
Snowpack/Precipitation - Snowpack has been nearly depleted in the Gila Basin. March precipitation ranged
from near 20 to 50 percent of average. Seasonal precipitation is near 65 percent of average.
General Discussion/Forecasts - Seasonal volume forecasts in the Gila Basin reflect the dry conditions
that exist in the Basin. April-May runoff volumes are forecast to range from 20 to 40 percent
of median.
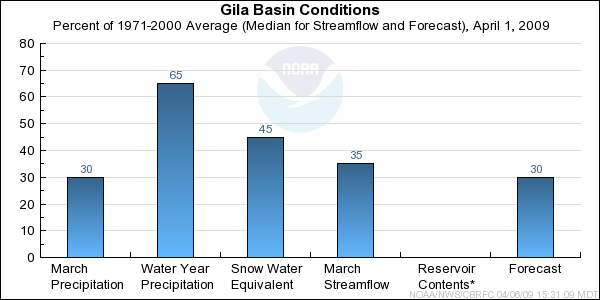
* Percent usable capacity, not percent average contents.
Click for multi-month Graph.
Little Colorado Basin Conditions
Model Soil Moisture/Observed Streamflow - Streamflow volumes for March were much above median on
some of the headwater locations, such as the Little Colorado near Lyman Lake, and Chevelon Creek.
Elsewhere streamflow volumes were below median.
Snowpack/Precipitation - Snowpack was above average in the Little Colorado southern headwaters on
March 1st. By early April much of the snowpack had melted off, resulting in enhanced streamflow on streams
draining these areas. Precipitation during March ranged from mostly 5 to 40 percent of average.
Seasonal precipitation is near 75 percent of average.
General Discussion/Forecasts - Streamflow volumes in the Little Colorado Basin are expected to
range from 20 to 50 percent of median for the April-May period.
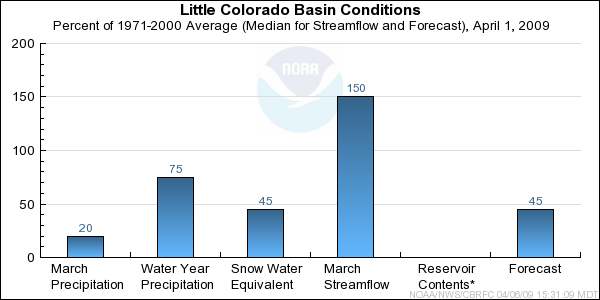
* Percent usable capacity, not percent average contents.
Click for multi-month Graph.
Differences between the full period forecasts and the residual forecasts may not exactly equal the actual observed volumes due to rounding conventions (see Definitions section).
Monthly Streamflows
Precipitation Maps
Hydrologist: G. Smith
