Note: This publication is currently undergoing major revisions. The current publication will be replaced with a new publication based on stakeholder requirements and scientific advances. We expect to begin sharing details on this soon. If you have input on content, format, or publication frequency at any time, please contact us at cbrfc.webmasters@noaa.gov.Lower Colorado Water Supply Outlook, April 1, 2010Lower Colorado Water Supply Outlook, April 1, 2010
Contents
Lower Colorado Summary
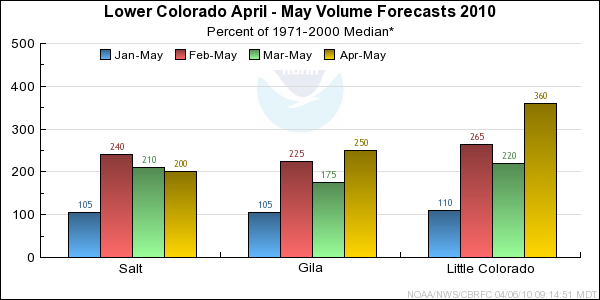
*Median of forecasts within each basin.
Salt Basin Conditions
The following conditions influenced this month's forecasts:
Precipitation:
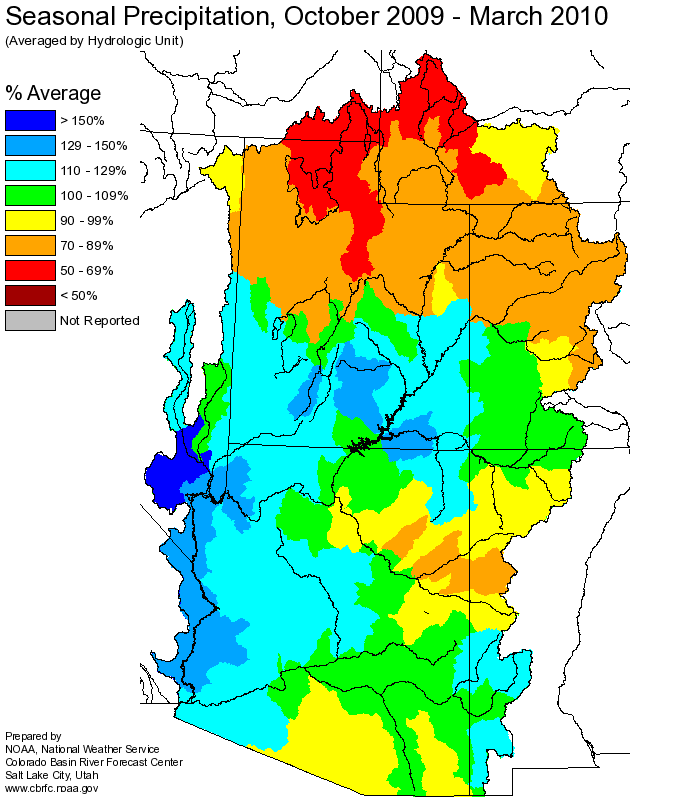
Seasonal October-March
precipitation ranged
from near 100 to 115 percent of average across the Salt and Verde River Basins.
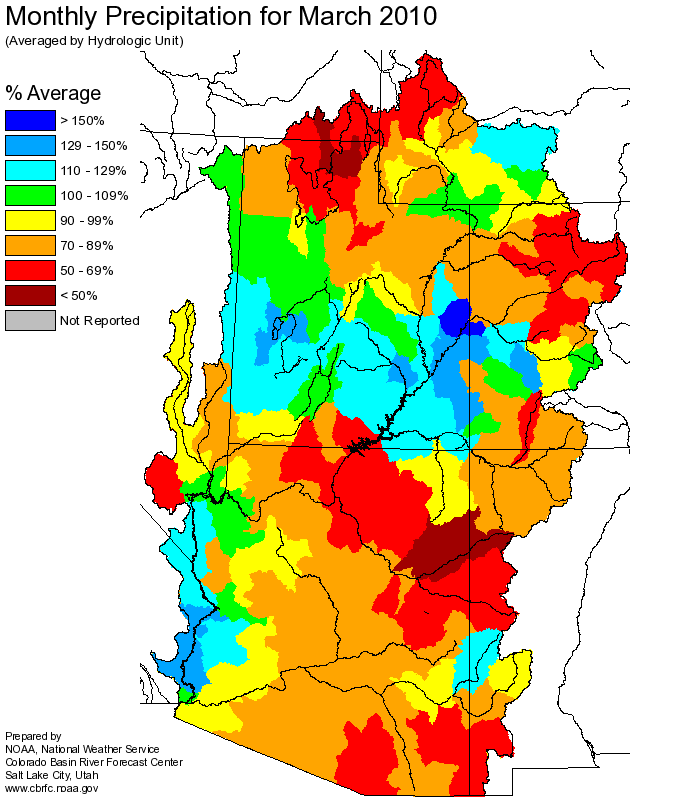
March
precipitation ranged from near 70 to 90 percent of average.
Streamflow:
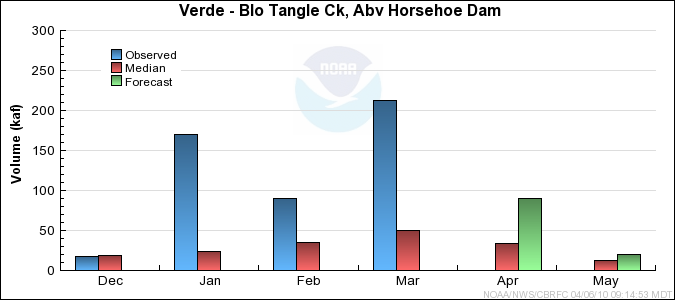
Precipitation combined with snow melt resulted in above median streamflow in March. Streamflow
volumes were near 115 percent of median on the Salt River, 430 percent on the Tonto River, and 270 percent of median on the Verde River.
Snow:
Significant snow remains at higher elevations in the Salt and Verde Basins. Basin snowpack was near
300 percent of average in the Verde Basin and 230 percent of average in the Salt Basin on April 1st. Although area coverage
of snowpack has been decreasing, some locations that are typically void of snow on April 1st still contain up
to 10 inches of water in the snowpack.
Salt River Basin
Snow Plot.
Verde River Basin
Snow Plot.
Soil Moisture:
Dry soils existed prior to the winter season. Soil moisture increased at lower elevations with rainfall
during the winter. Areas with persistent snowpack throughout the winter maintained dry soils
prior to the onset of snow melt.
Climate Forecasts:
El Nino climate conditions are expected to persist through the spring. The El Nino influence was accounted for in
generation of forecasts this season. While El Nino climate conditions suggest increased chances for precipitation during
the winter and early spring months, the relationship between El Nino and precipitation is much weaker during
the April-June period.
Forecast Summary:
A significant snowpack exists at high elevations of the Salt and Verde Basins for this time of year. Above average
runoff is anticipated over the next 2 months, however limited areal coverage of the snowpack combined with dry soils
that existed prior to the onset of snow melt may reduce volumes. April through May
streamflow volumes
from 180 to 250 percent of median are expected.
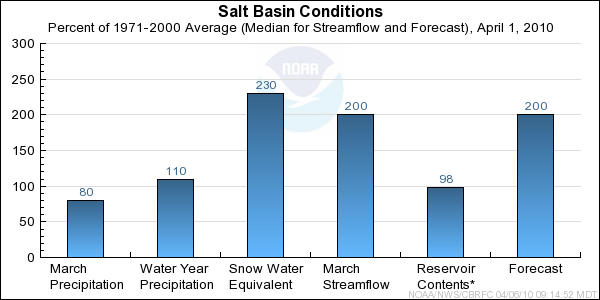
* Percent usable capacity, not percent average contents.
Click for multi-month Graph.
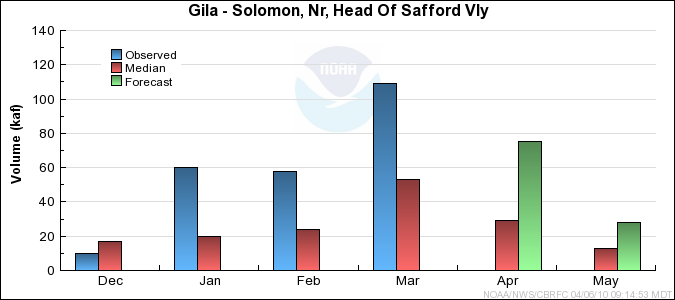
Gila Basin Conditions
The following conditions influenced this month's forecasts:
Precipitation:
Seasonal October-March
precipitation is near 110 percent of
average in upper Gila River Basin.
March
precipitation ranged from 100 to 110 percent of average in the upper Gila River Basin.
Streamflow:
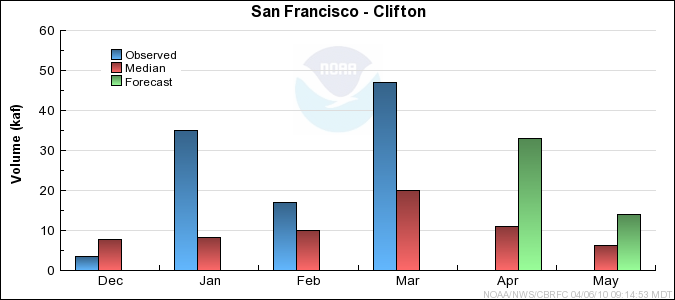
March streamflow volumes were 200 to 280 percent of median in the San Francisco and upper Gila River Basin due to rainfall
and snow melt during the month.
Snow:
Upper Gila Basin snowpack was near 240 percent of average on April 1st. The largest amount of water in the snowpack
was at highest elevations, but snowcover at these elevations is limited in areal extent.
Upper Gila Basin
Snow Plot.
San Francisco Basin
Snow Plot
Soil Moisture:
Dry soils existed prior to the winter season. Soil moisture increased at lower elevations with rainfall
during the winter. Areas with persistent snowpack throughout the winter maintained dry soils
prior to the onset of snow melt.
Climate Forecasts:
El Nino climate conditions are expected to persist through the spring. The El Nino influence was accounted for in
generation of forecasts this season. While El Nino climate conditions suggest increased chances for preciptation during
the winter and early spring months, the relationship between El Nino and precipitation is much weaker during
the April-June period.
Forecast Summary:
Above average snowpack exists in the upper Gila Basin particularly at highest elevations above 9000 feet.
Above average runoff is anticipated over the next 2 months, however limited areal coverage of the snowpack
combined with dry soils that existed prior to the onset of snow melt may reduce volumes.
April through May
streamflow volumes are expected to range mostly between 200 to 300 percent of median.

* Percent usable capacity, not percent average contents.
Click for multi-month Graph.
Little Colorado Basin Conditions
The following conditions influenced this month's forecasts:
Precipitation:
Seasonal October-March
precipitation
ranged from 80 to 120 percent of average throughout the Little Colorado Basin.
March
precipitation ranged from 50 to 85 percent of average. Headwater locations were near
90 percent of average.
Streamflow:
Although observed streamflow data was limited, March streamflow volumes in the Little Colorado were below median in
the higher elevations. Below average precipitation and below average
temperatures for the month reduced snow melt.
Snow:
Basin snowpack conditions ranged frome 180 to 300 percent of average on April 1st
in the Southern Headwaters of the Little Colorado Basin.
Little Colorado Southern Headwaters
Snow Plot
Central Mogollon Rim
Snow Plot
Soil Moisture:
Dry soils existed prior to the winter season. Soil moisture increased at lower elevations with rainfall
during the winter. Areas with persistent snowpack throughout the winter maintained dry soils
prior to the onset of snow melt.
Climate Forecasts:
El Nino climate conditions are expected to persist through the spring. The El Nino influence was accounted for in
generation of forecasts this season. While El Nino climate conditions suggest increased chances for preciptation during
the winter and early spring months, the relationship between El Nino and precipitation is much weaker during
the April-June period.
Forecast Summary:
Significant snowpack exists in higher elevations of the Little Colorado drainage for this time of year.
While above median volumes are expected over the next 2-3 months, dry soils that existed under the snowpack
prior to the onset of snow melt could act to reduce snow melt runoff volumes.
April through May
streamflow volumes from near 200 to 500 percent of median are expected.

* Percent usable capacity, not percent average contents.
Click for multi-month Graph.
Differences between the full period forecasts and the residual forecasts may not exactly equal the actual observed volumes due to rounding conventions (see Definitions section).
Monthly Streamflows


Precipitation Maps
Hydrologist: G. Smith
