NOAA, National Weather Service
Colorado Basin River Forecast Center
Salt Lake City, Utah
www.cbrfc.noaa.gov
| Prepared by G. Smith NOAA, National Weather Service Colorado Basin River Forecast Center Salt Lake City, Utah www.cbrfc.noaa.gov |
| Forecast Period | 90% Exceedance Volume | 50% Exceedance Volume | Percent Median | 10% Exceedance Volume | |
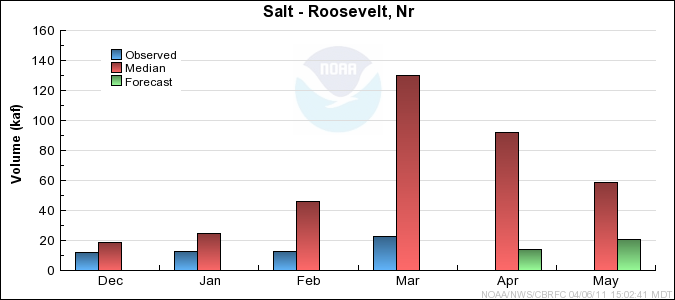
| Salt | |||||
| Roosevelt, Nr | April-May | 15 | 21 | 14.7 | 45 |
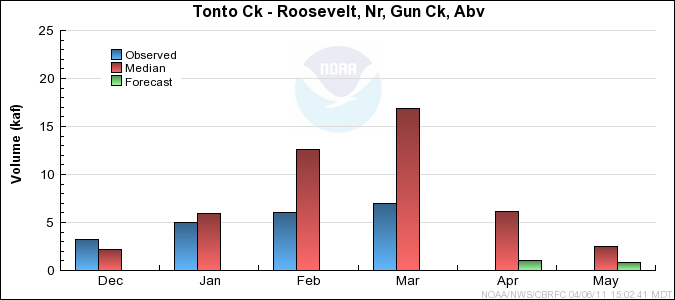
| Tonto Ck | |||||
| Roosevelt, Nr, Gun Ck, Abv | April-May | 0.8 | 1.8 | 21 | 4.7 |
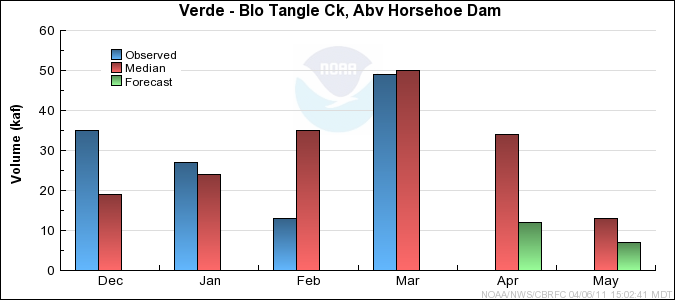
| Verde | |||||
| Blo Tangle Ck, Abv Horsehoe Dam | April-May | 12.5 | 19 | 43 | 34 |
| Forecast Period | 90% Exceedance Volume | 50% Exceedance Volume | Percent Median | 10% Exceedance Volume | |
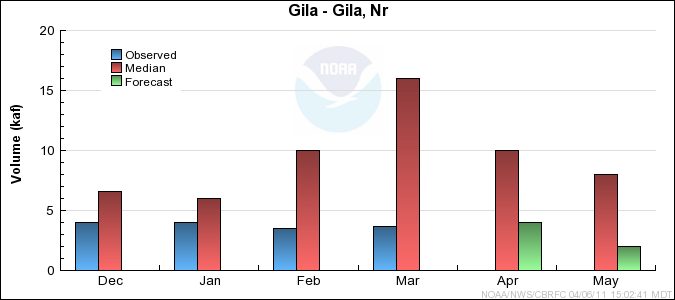
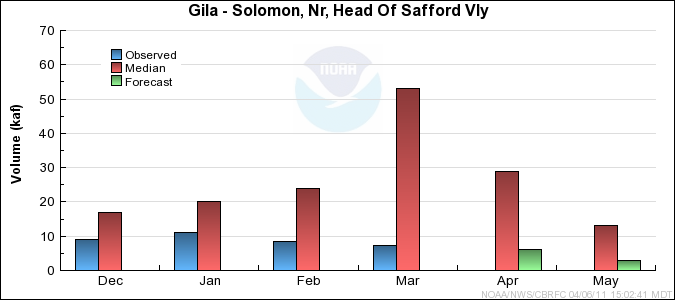
| Gila | |||||
| Gila, Nr | April-May | 2.7 | 6 | 35 | 11.3 |
| Virden, Nr, Blue Ck, Blo | April-May | 2.5 | 5.5 | 23 | 12 |
| Solomon, Nr, Head Of Safford Vly | April-May | 6.5 | 9 | 21 | 19 |
| San Carlos Res, Coolidge Dam, At | April-May | 0.8 | 3 | 19.5 | 6.5 |
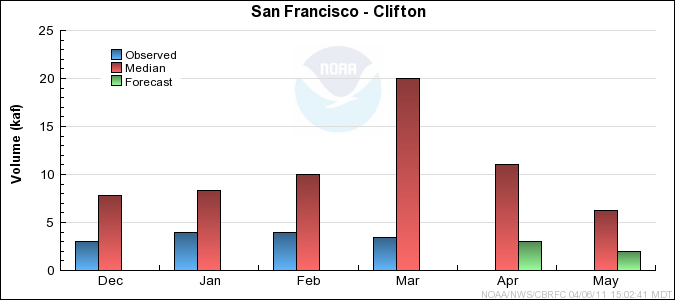
| San Francisco | |||||
| Glenwood, Nr | April-May | 1.5 | 2 | 26 | 5.4 |
| Clifton | April-May | 3.9 | 5 | 27 | 12.5 |
| Forecast Period | 90% Exceedance Volume | 50% Exceedance Volume | Percent Median | 10% Exceedance Volume | |
| Little Colorado | |||||
| Lyman Lk, Abv, St. Johns, Nr | April-June | 0.01 | 0.2 | 4.7 | 0.95 |
| Woodruff | April-May | 0.02 | 0.15 | 17.9 | 1 |
| Rio Nutria | |||||
| Ramah, Nr | April-May | 0 | 0.1 | 19.2 | 0.49 |
| Zuni | |||||
| Black Rock Res, Abv | April-May | 0 | 0.1 | 15.6 | 1.6 |
| Cebolla Ck | |||||
| Ramah Res | April-May | 0 | 0.05 | 17.2 | 0.99 |
| East Clear Ck | |||||
| Blue Ridge Res, Pine, Nr | April-May | 0.06 | 1 | 20 | 4.2 |
| Clear Ck | |||||
| Winslow, Nr | April-May | 0.8 | 2 | 10 | 4.5 |
| Chevelon Ck | |||||
| Winslow, Nr, Wildcat Cyn, Blo | April-May | 0.5 | 1.5 | 26 | 3.5 |
| Walnut Ck | |||||
| Lake Mary | April-May | 0.13 | 0.4 | 27 | 0.9 |
| Usable Capacity | EOM Contents | Percent Usable Capacity | Last Year EOM | Last Year %Capacity | |
| Salt | |||||
| Roosevelt | 1653.0 | 1543.9 | 93 | 1633.1 | 99 |
| Horse Mesa | 245.0 | 235.6 | 96 | 227.0 | 93 |
| Mormon Flat | 58.0 | 54.3 | 94 | 54.7 | 94 |
| Stewart Mountain | 70.0 | 63.5 | 91 | 65.4 | 93 |
| Horseshoe | 109.2 | 32.2 | 29 | 108.3 | 99 |
| Bartlett | 178.0 | 121.8 | 68 | 174.6 | 98 |
|
| |||||
| TOTAL | 2313.2 | 2051.1 | 89 | 2263.2 | 98 |
| Little Colorado | |||||
| Lyman Lake | 31.0 | 19.5 | 63 | 13.0 | 42 |
| Bill Williams | |||||
| Alamo | 1045.0 | 136.0 | 13 | 177.2 | 17 |
| Agua Fria | |||||
| Lake Pleasant | 1145.0 | 790.1 | 69 | 814.7 | 71 |
| Gila | |||||
| San Carlos | 885.0 | 95.0 | 11 | 253.2 | 29 |
| Painted Rock | 2476.0 | 0.0 | 0 | 86.0 | 3 |
| Colorado | |||||
| Lake Powell | 24322.0 | 12820.1 | 53 | 13700.8 | 56 |
| Lake Mead | 27380.0 | 11169.0 | 41 | 11538.0 | 42 |
| Lake Mohave | 1810.0 | 1707.8 | 94 | 1676.9 | 93 |
| Lake Havasu | 619.0 | 577.4 | 93 | 570.7 | 92 |
|
| |||||
| TOTAL | 59713.0 | 27315.0 | 46 | 28830.5 | 48 |
| Range | Round to | |
| 0-1.99 | 0.01 | |
| 2.0-19.9 | 0.1 | |
| 20-199 | 1.0 | |
| 200-999 | 5.0 | |
| 1000+ | 3 significant digits |