Note: This publication is currently undergoing major revisions. The current publication will be replaced with a new publication based on stakeholder requirements and scientific advances. We expect to begin sharing details on this soon. If you have input on content, format, or publication frequency at any time, please contact us at cbrfc.webmasters@noaa.gov.Lake Powell Water Supply Outlook, January 1, 2008Lake Powell Water Supply Outlook, January 1, 2008
Contents
Lake Powell Sub-Basin Summaries
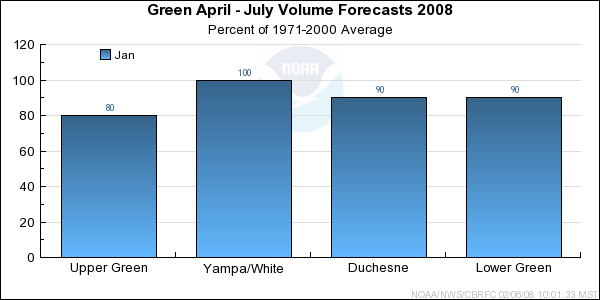
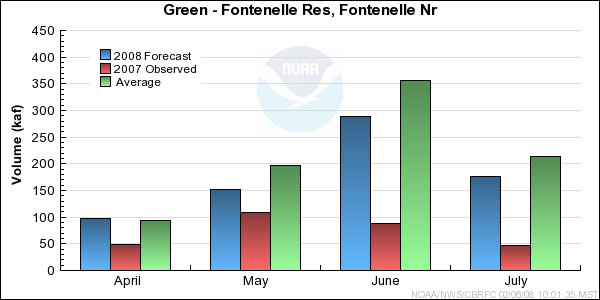
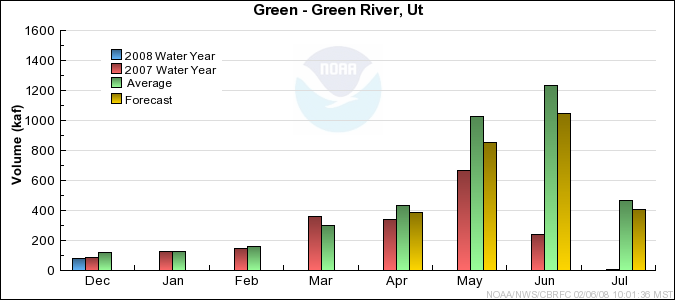
Water Supply forecasts vary over the Green River basin from below normal
values in the Upper Basin (points above Flaming Gorge) to near normal conditions in the other regions.
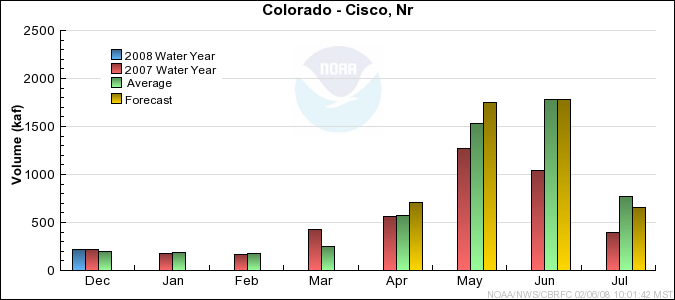
This follows water year 2007 where observed flows through out the basin were
below to much below average. However, it is still early in the snow
accumulation season and there is ample time for conditions to change.
*Median of forecasts within each basin.
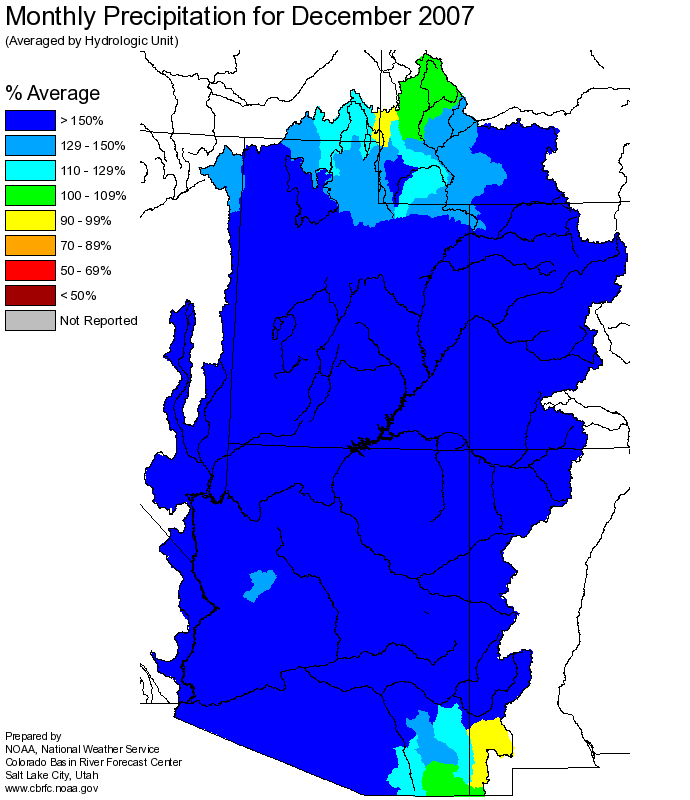
December was exceptionally wet across the Upper Colorado Basin, especially in
the Gunnison and Dolores basins where several individual precipitation stations
received more than 300% of average for the month.

*Median of forecasts within each basin.
January precipitation was much above average with 260% of average. Snow water equivalents were
also much above average with 130% across the Basin. Streamflow for December was also much
above average.
*Median of forecasts within each basin.
Upper Green Basin Conditions
The Upper Green Basin stands out as having the lowest April through July Forecasts in the Colorado
River Basin at this time. Despite December's above average precipitation, snow pack remains below average.
After 5 years of below average flows, soils are very dry and influenced a lower forecast.
This soil moisture deficit will persist through the forecast season.
While climate forecasts indicate the chance for above average precipitation over the
northern portion of the basin, this has yet to materialize.
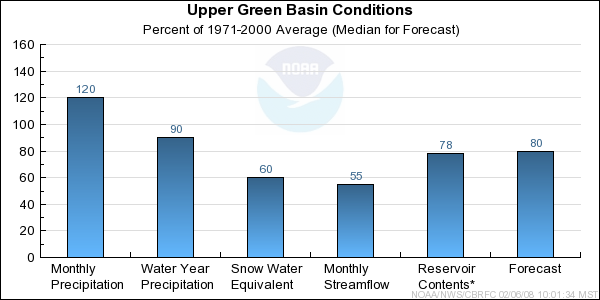
* Percent usable capacity, not percent average contents.
Click for multi-month Graph.
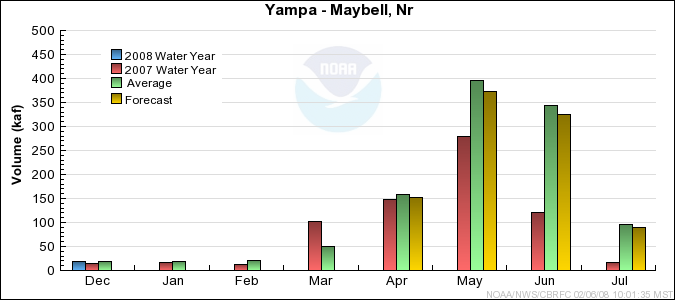
Yampa/White Basin Conditions
Portions of the Yampa Basin are the only regions of the Green where forecasts
are above 100% of average. This includes the Little Snake and Elk Rivers.
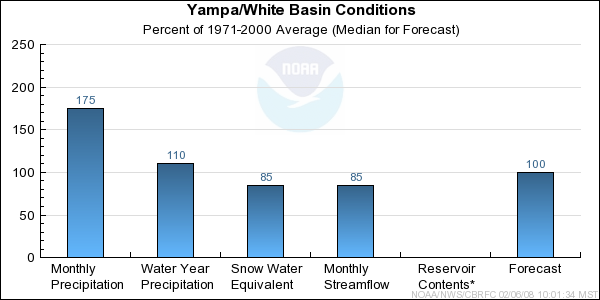
* Percent usable capacity, not percent average contents.
Click for multi-month Graph.
Duchesne Basin Conditions
Snow pack in the Uinta Basin varies greatly. While some lower elevation stations
are reporting near average snow water equivalent conditions, upper elevation sites remain below average. December's monthly
precipitation was above average partly due to very high amounts at low elevations station that do not
normally recieve significant precipitation. Meteorological models indicate the western portion of the basin will receive significant
precipitation the second weekend of January that will improve the snow pack in the short term.
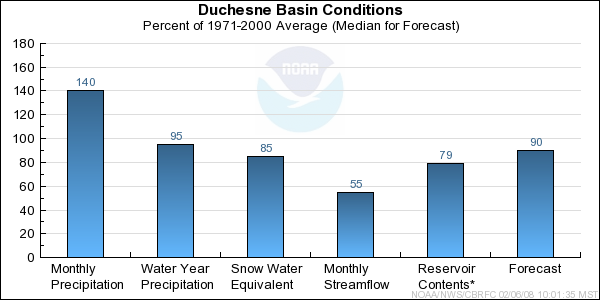
* Percent usable capacity, not percent average contents.
Click for multi-month Graph.
Lower Green Basin Conditions
As in the Duchesne Basin, large amounts of precipitation at lower elevation gages pushed the monthly
totals near 200 percent of average. Runoff in the Lower Green Basin, points in the Price and San Rafael drainages, is expected to be near average.
Some snow sites in the along the Wasatch Plateau are above average as a result of favorable
storm direction during events in early December. Slightly to the east, stations
report near average conditions. As in the Western Uinta Basin, there exists the
potential for significant accumulation with the storms arriving in early January.
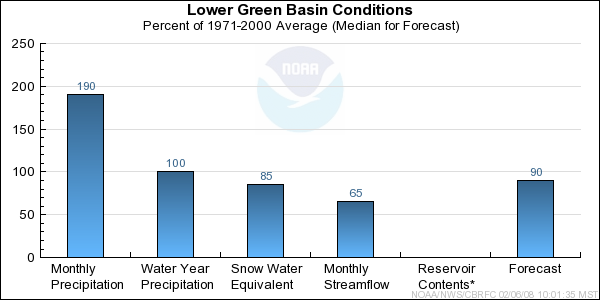
* Percent usable capacity, not percent average contents.
Click for multi-month Graph.
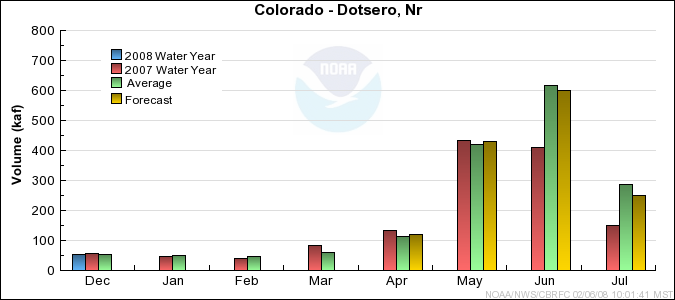
Upper Colorado Mainstem Basin Conditions
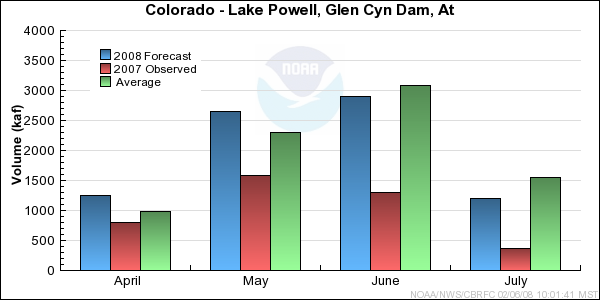
The 2008 water year started with above average precipitation for October, but
then November was just 30% of average. December made up for that with 170% of
average precipitation for the month, leaving both the seasonal precipitation
and snow water equivalent near normal as of January 1. The April through July
streamflow forecasts now range between 85% and 105% of average.
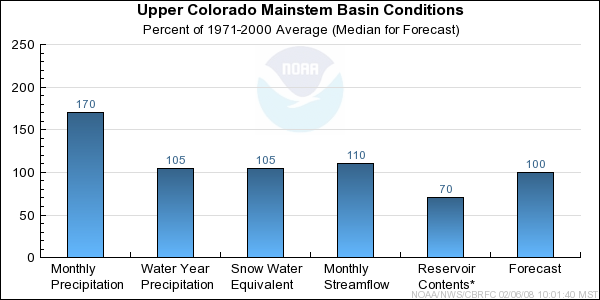
* Percent usable capacity, not percent average contents.
Click for multi-month Graph.
Gunnison Basin Conditions
Precipitation in the Gunnison Basin for October was 86% of average. It was
then a dry November with the basin receiving 28% of the monthly average.
However, in December the basin received 215% of the monthly average
precipitation allowing the seasonal average precipitation for the beginning
of January to climb back to 116%. Streamflow forecasts for April through July
currently range between 105% and 120% of average.
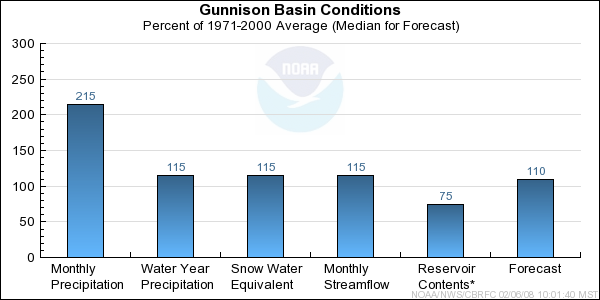
* Percent usable capacity, not percent average contents.
Click for multi-month Graph.
Dolores Basin Conditions
It was a slow beginning to the 2008 water year in the Dolores Basin. In
October the basin saw 66% of the monthly average precipitation and in November
just 29%. December more than made up for the light precipitation in October
and November with the basin receiving 260% of the December monthly average.
This has brought the basin back above average precipitation for the season to
112% of the seasonal average as of January 1. Streamflow
forecasts for April through July currently range between 110% and 115% of
average.
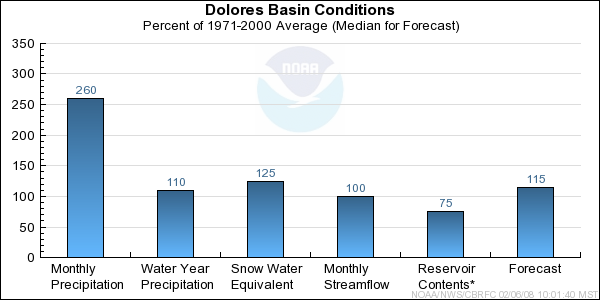
* Percent usable capacity, not percent average contents.
Click for multi-month Graph.
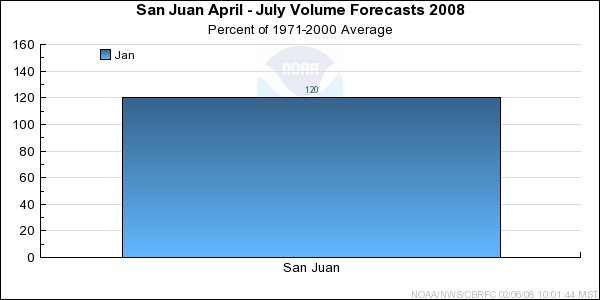
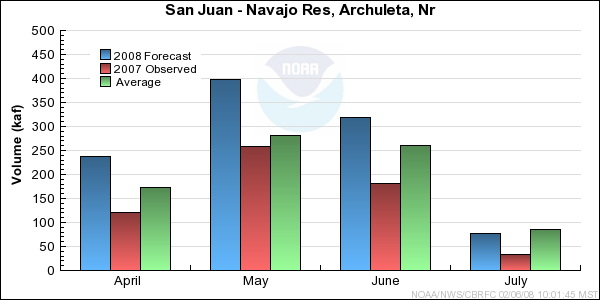
San Juan Basin Conditions
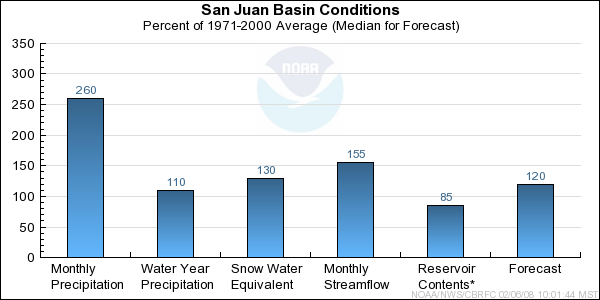
* Percent usable capacity, not percent average contents.
Click for multi-month Graph.
Differences between the full period forecasts and the residual forecasts may not exactly equal the actual observed volumes due to rounding conventions (see Definitions section).
Reservoir Monthly Inflow Forecasts


Monthly Streamflows


Precipitation Maps