Note: This publication is currently undergoing major revisions. The current publication will be replaced with a new publication based on stakeholder requirements and scientific advances. We expect to begin sharing details on this soon. If you have input on content, format, or publication frequency at any time, please contact us at cbrfc.webmasters@noaa.gov.Lake Powell Water Supply Outlook, January 1, 2011Lake Powell Water Supply Outlook, January 1, 2011
Contents
Lake Powell Sub-Basin Summaries
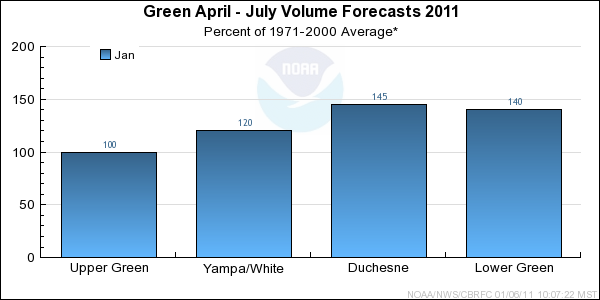
*Median of forecasts within each basin.

*Median of forecasts within each basin.
*Median of forecasts within each basin.
Upper Green Basin Conditions
The following conditions influenced this month's forecasts:
Precipitation:
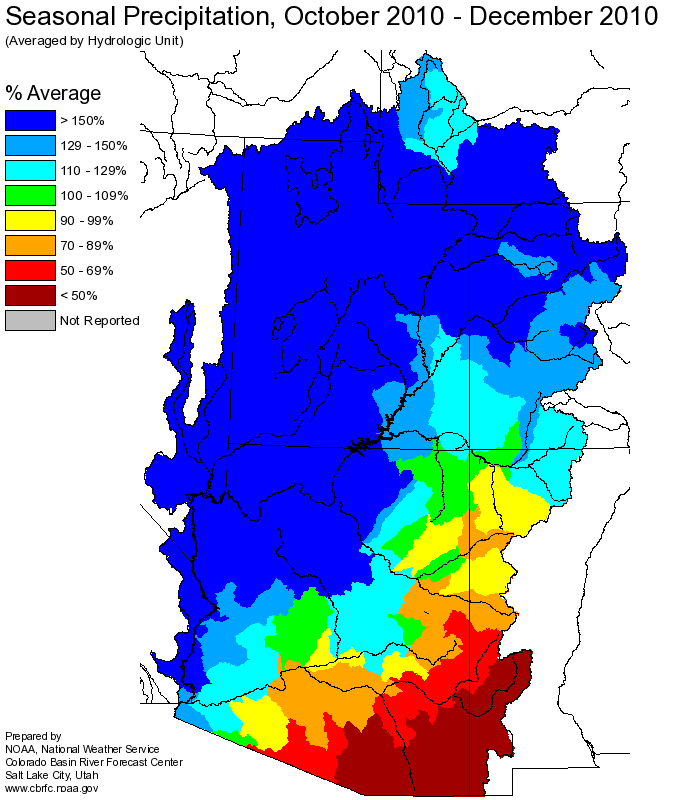
Seasonal October through December
precipitation was 150 percent of average
in the Upper Green basin. December
precipitation was 215 percent of average.
Snow:
January 1st snow water equivalent was 130 percent of average in the basin.
--- Upper Green basin
snow
water equivalent plot.
Streamflow:
December streamflow was near 110 percent of average.
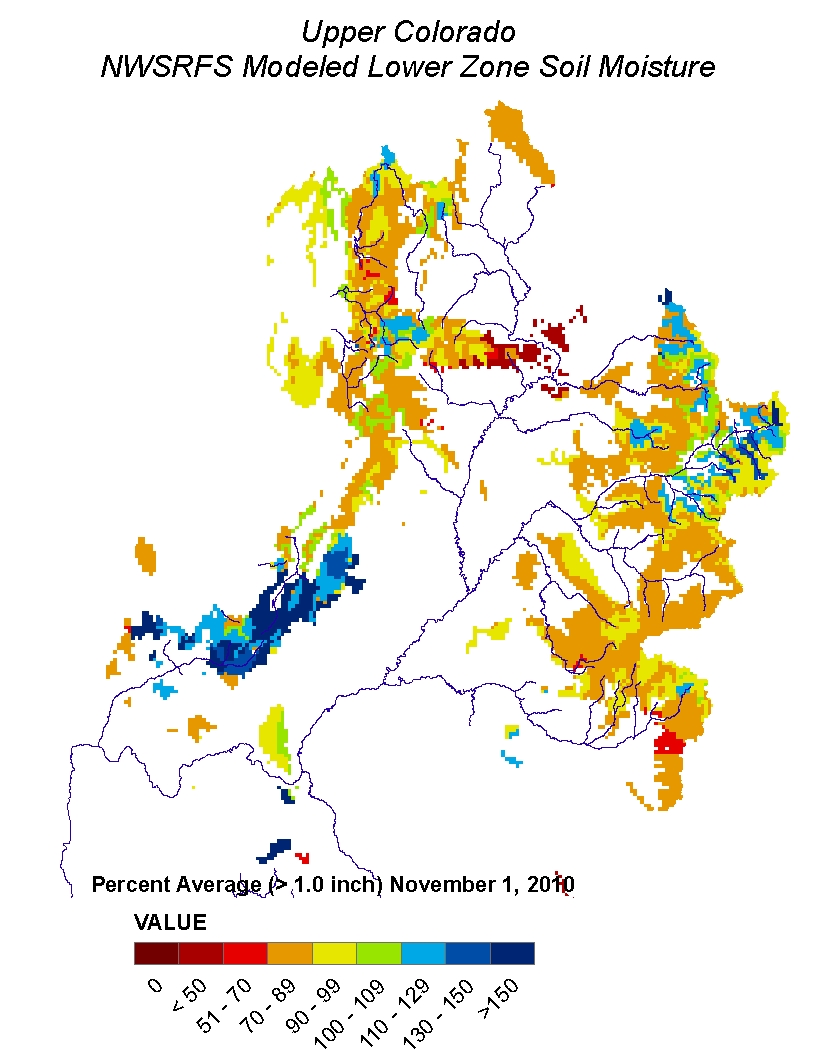
Soil Moisture:
Modeled
soil
moisture states were below average heading into the winter.
Climate Forecasts:
Climate forecasts were not a factor because there is not a strong correlation
between La Nina conditions and winter precipitation in the Upper Green basin.
Forecast Summary:
The Upper Green has received much above average monthly precipitation since October. As of January 1st,
both seasonal precipitation and snow water equivalent are much above average. Despite the much above average conditions,
it is early in the snow accumulation period and snow water equivalent is currently 55% of the average seasonal peak.
It is also important to note that our models assume near normal precipitation into the future. As a result,
current April through July streamflow volume forecasts range between 100 and 118 percent of average with
a median value of 100 percent.
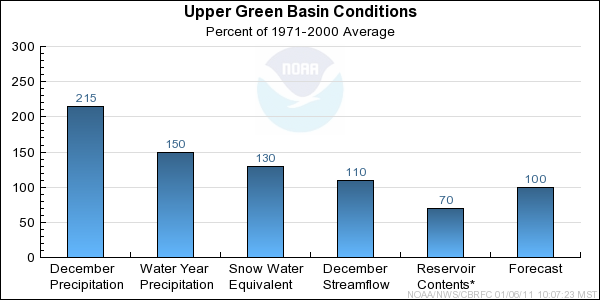
* Percent usable capacity, not percent average contents.
Click for multi-month Graph.
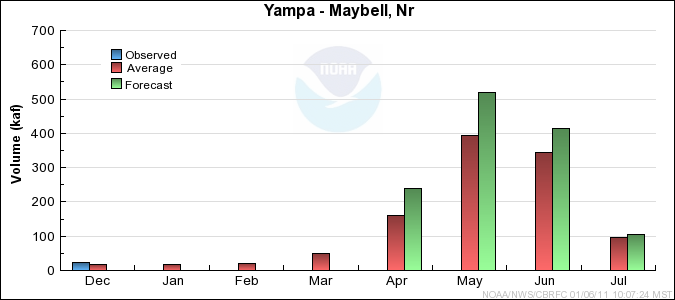
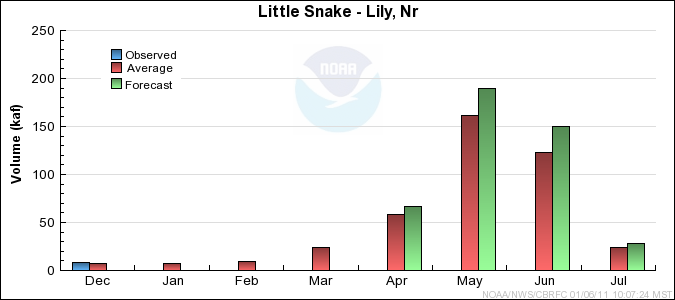
Yampa/White Basin Conditions
The following conditions influenced this month's forecasts:
Precipitation:
Seasonal October through December
precipitation was 165 percent of average
in the Yampa/White basin. December
precipitation was 230 percent of average.
Snow:
January 1st snow water equivalent was 150 percent of average in the basin.
--- Yampa basin
snow
water equivalent plot.
Streamflow:
December streamflow was near 110 percent of average.
Soil Moisture:
Modeled
soil
moisture states were near average heading into the winter for the Yampa, Little Snake,and
White River basins.
Climate Forecasts:
Climate forecasts were not a factor in the forecasts because there is not a strong correlation
between La Nina conditions and winter precipitation in the Yampa/White basin.
Forecast Summary:
The Yampa and White river basins have received much above average monthly precipitation since October. As of January 1st,
both seasonal precipitation and snow water equivalent are much above average. Despite the much above average conditions,
it is early in the snow accumulation period and snow water equivalent is currently near 60% of the average seasonal peak.
It is also important to note that our models assume near normal precipitation into the future. As a result,
current April through July streamflow volume forecasts range between 108 and 134 percent of average with
a median value of 120 percent.

* Percent usable capacity, not percent average contents.
Click for multi-month Graph.
Duchesne Basin Conditions
The following conditions influenced this month's forecasts:
Precipitation:
Seasonal October through December
precipitation was 230 percent of average
in the Duchesne basin. December
precipitation was 330 percent of average.
Snow:
January 1st snow water equivalent was 210 percent of average in the basin
as a whole.
--- Duchesne basin
snow
water equivalent plot.
Streamflow:
December streamflow was 100 percent of average.
Soil Moisture:
Modeled
soil
moisture states were much below average to below average heading into the winter.
Climate Forecasts:
Climate forecasts were not a factor in the forecasts because there is not a strong correlation
between La Nina conditions and winter precipitation in the Duchesne basin.
Forecast Summary:
The Duchesne river basin has received much above average monthly precipitation since October. As of January 1st,
both seasonal precipitation and snow water equivalent are much above average. However,it is important to note
that it is still early in the snow accumlation period and that our models assume near normal
precipitation into the future. As a result, current April through July
streamflow volume forecasts range between 115 and 174 percent of average with a median value of 145 percent.

* Percent usable capacity, not percent average contents.
Click for multi-month Graph.
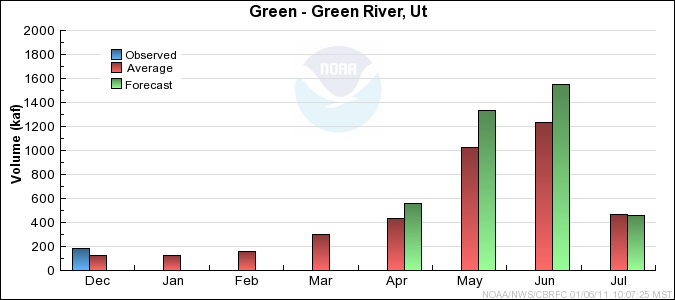
Lower Green Basin Conditions
The following conditions influenced this month's forecasts:
Precipitation:
Seasonal October through December
precipitation was 240 percent of average
in the Lower Green basin. December
precipitation was 350 percent of average.
Snow:
January 1st snow water equivalent was 205 percent of average in the basin
as a whole.
--- Lower Green basin
snow
water equivalent plot.
Streamflow:
December streamflow was near 150 percent of average.
Soil Moisture:
Modeled
soil
moisture states were much below to near average heading into the winter.
Climate Forecasts:
Climate forecasts were not a factor in the forecasts because there is not a strong correlation
between La Nina conditions and winter precipitation in the Lower Green basin.
Forecast Summary:
The Lower Green has received above to much above average monthly precipitation since October. As of January 1st,
both seasonal precipitation and snow water equivalent are much above average. However, it is important to note
that it is still early in the snow accumlation period and that our models assume near normal
precipitation into the future. As a result, current April through July streamflow volume forecasts
range between 141 and 176 percent of average with a median value of 140 percent.
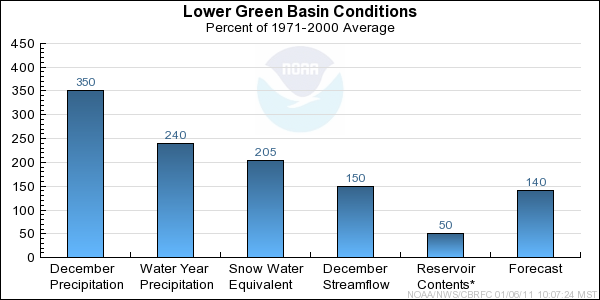
* Percent usable capacity, not percent average contents.
Click for multi-month Graph.
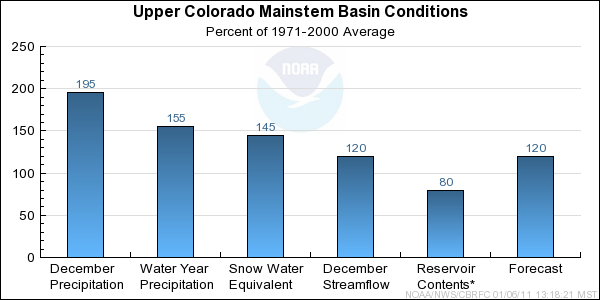
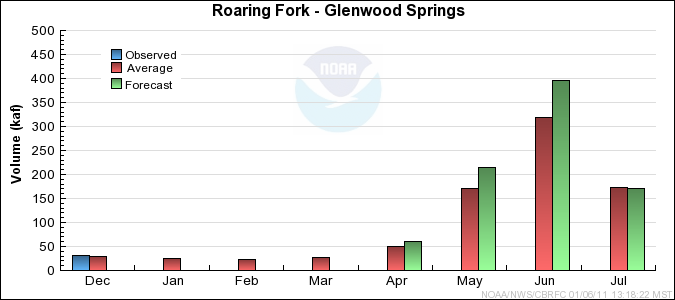
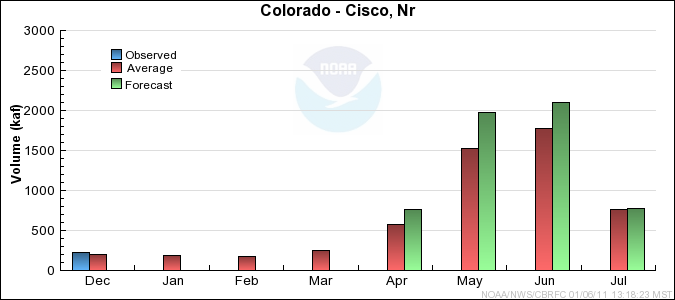
Upper Colorado Mainstem Basin Conditions
The following conditions influenced this month's forecasts:
Precipitation:
Seasonal October through December
precipitation
was near 155 percent of average in the Upper Colorado mainstem basin.
December
precipitation was near 195 percent of average.
Snow:
January 1st snow water equivalent was near 145 percent of average in the basin
as a whole; this is 60% of the seasonal peak.
--- Upper Colorado basin
snow
water equivalent plot
Streamflow:
December streamflow was near 120 percent of average.
Soil Moisture:
Modeled
soil
moisture states were near to above average heading into the winter.
Climate Forecasts:
Climate forecasts were not a factor because there is not a strong correlation
between La Nina conditions and winter precipitation in the Upper Colorado mainstem basin.
Forecast Summary:
Monthly precipitation has been above to much above average in the Upper Colorado
mainstem each month of the water year so far, with December being the highest
yet. As of January 1st both the seasonal precipitation and snow water
equivalent are near 150% of average. However, it is early in the snow
accumulation period (January 1st snow water equivalent is 60% of the average seasonal peak)
and our models assume near normal precipitation into the future.
Therefore, current April through July streamflow volume
forecasts
range between 113 and 139 percent of average with a median value of 120 percent.
* Percent usable capacity, not percent average contents.
Click for multi-month Graph.
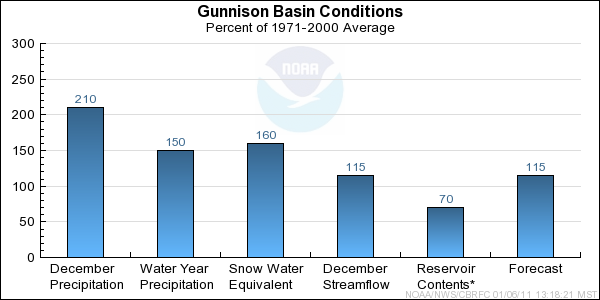
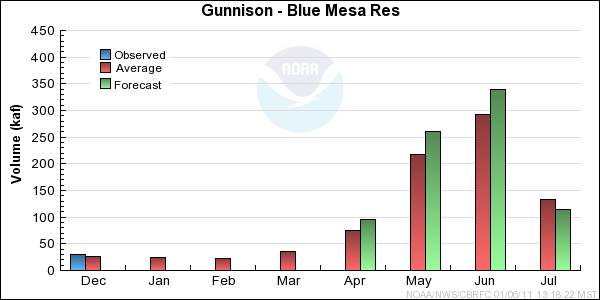
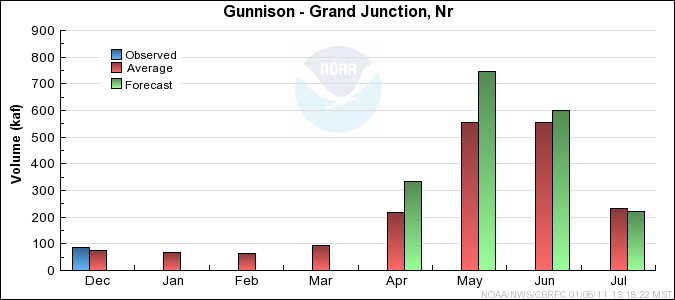
Gunnison Basin Conditions
The following conditions influenced this month's forecasts:
Precipitation:
Seasonal October through January
precipitation was 150 percent of average
in the Gunnison basin. December
precipitation was 210 percent of average.
Snow:
January 1st snow water equivalent was 160 percent of average in the Gunnison basin.
--- Gunnison basin
snow
water equivalent plot
Streamflow:
December streamflow was 115 percent of average.
Soil Moisture:
Modeled
soil
moisture states were below to near average heading into the winter.
Climate Forecasts:
Climate forecasts were not a factor because there is not a strong correlation
between La Nina conditions and winter precipitation in the Gunnison basin.
Forecast Summary:
January precipitation throughout the Gunnison basin was 210% of average. January 1st snow water equivalent for the Gunnison was much above average
with 160%. However, it is early in the snow accumulation period (January 1st snow water equivalent is 65% of the average seasonal peak)
and our models assume near normal precipitation into the future. Therefore, current April through July streamflow volume
forecasts
range between 103 and 146 percent of average with a median value of 115 percent.
* Percent usable capacity, not percent average contents.
Click for multi-month Graph.
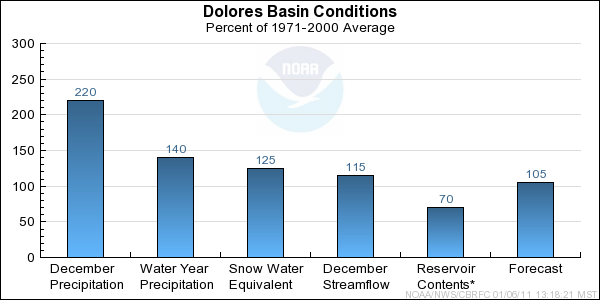
Dolores Basin Conditions
The following conditions influenced this month's forecasts:
Precipitation:
Seasonal October through January
precipitation was 140 percent of average
in the entire Dolores basin. December
precipitation was 220 percent of average.
Snow:
January 1st snow water equivalent was 125 percent of average in the Dolores basin.
--- Dolores basin
snow
water equivalent plot
Streamflow:
December streamflow was 115 percent of average.
Soil Moisture:
Modeled
soil
moisture states were average to slightly below average heading into the winter.
Climate Forecasts:
The correlation of El Nino and April through July water volumes in the Dolores basin is small that
it did not influence the forecast process.
Forecast Summary:
January precipitation throughout the Dolores Basin was 220% of average. Seasonal October through January precipitation in the Dolores basin was much above average with
140%. However, it is early in the snow accumulation period (January 1st snow water equivalent is 50% of the average seasonal peak)
and our models assume near normal precipitation into the future. Therefore, current April through July streamflow volume
forecasts range between
106 and 109 percent of average, with a median value of 105 percent.
* Percent usable capacity, not percent average contents.
Click for multi-month Graph.
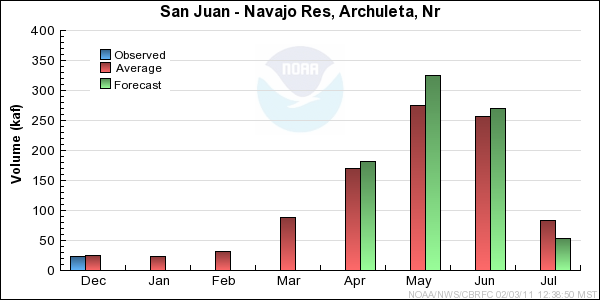
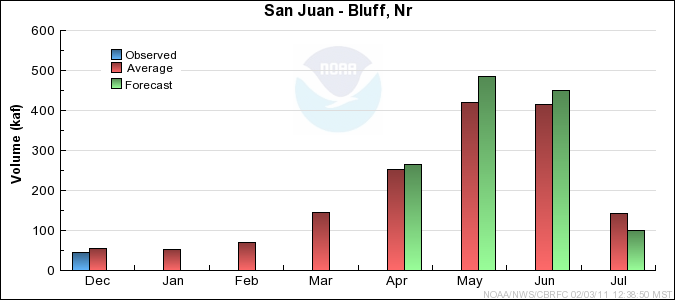
San Juan Basin Conditions
The following conditions influenced this month's forecasts:
Precipitation:
Seasonal October through December
precipitation amounts rose from last month to above average, 125%, due to the very heavy
precipitation during the last part of December.
December
precipitation was much above average with 210%
Snow:
Current snow water equivalent for the entire basin is 135%, which is much above average. The Animas basin is similar with 135%, while above Navajo
snow water equivalent was 125 percent of average.
--- Animas River Basin
Snow Plot.
--- Above Navajo Basin
Snow Plot.
Streamflow:
Streamflow for the entire San Juan Basin was below average for December with 85%. Seasonal streamflow since October
continued to be below average with 65%, due to the much below average fall precipitation.
Soil Moisture:
Modeled
soil
moisture as of November 1st, 2010 was average to below average across the entire San Juan Basin.
Climate Forecasts:
The correlation of La Nina and April through July water volumes in the San Juan basin does suggest slightly drier than average December through May precipitation,
but it did not influence the February forecast process.
Forecast Summary:
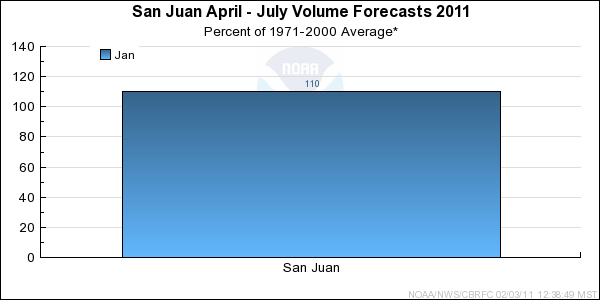
Seasonal precipitation and current snowpack are above to much above average. Also, soil moisture conditions before
the winter season were near average in the upper basin. This drove the San Juan Water Supply
April-July forecast to a median value of 110 percent.

* Percent usable capacity, not percent average contents.
Click for multi-month Graph.
Differences between the full period forecasts and the residual forecasts may not exactly equal the actual observed volumes due to rounding conventions (see Definitions section).
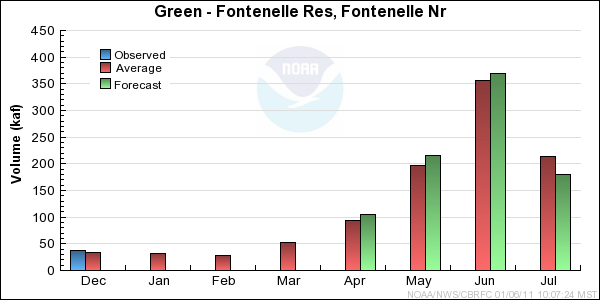
Reservoir Monthly Inflow Forecasts

Monthly Streamflows

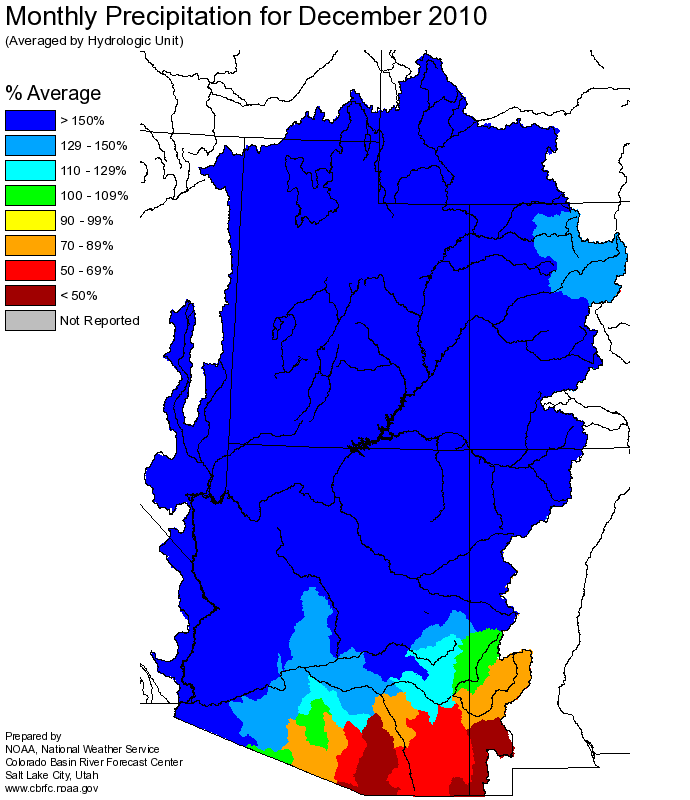
Precipitation Maps
