New 1981-2010 Averages being used this year. Note: This publication is currently undergoing major revisions. The current publication will be replaced with a new publication based on stakeholder requirements and scientific advances. We expect to begin sharing details on this soon. If you have input on content, format, or publication frequency at any time, please contact us at cbrfc.webmasters@noaa.gov.Lake Powell Water Supply Outlook, March 1, 2012
The following conditions influenced this month's forecasts:
Precipitation:
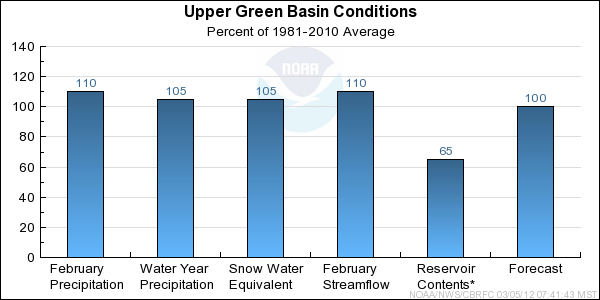
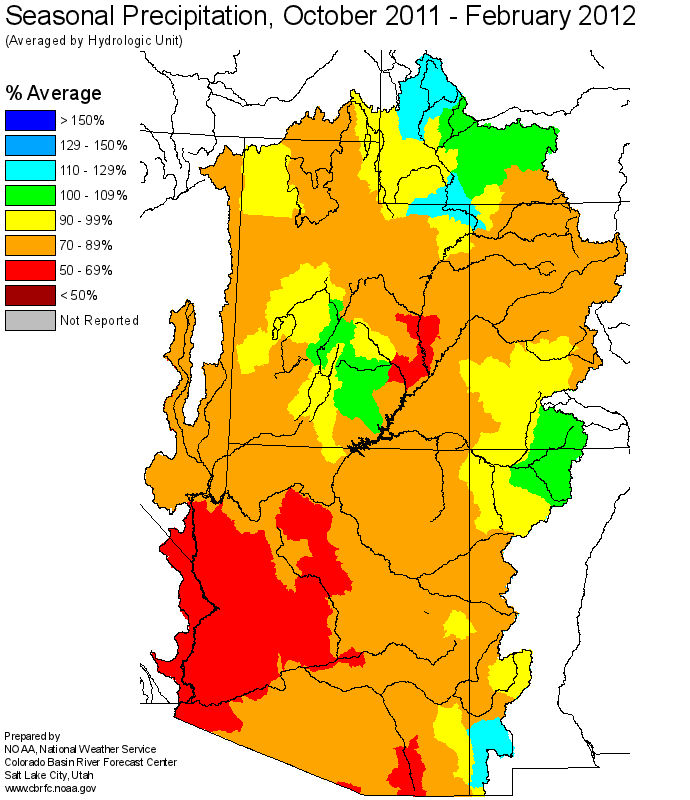
Seasonal October through February precipitation was 105 percent of average
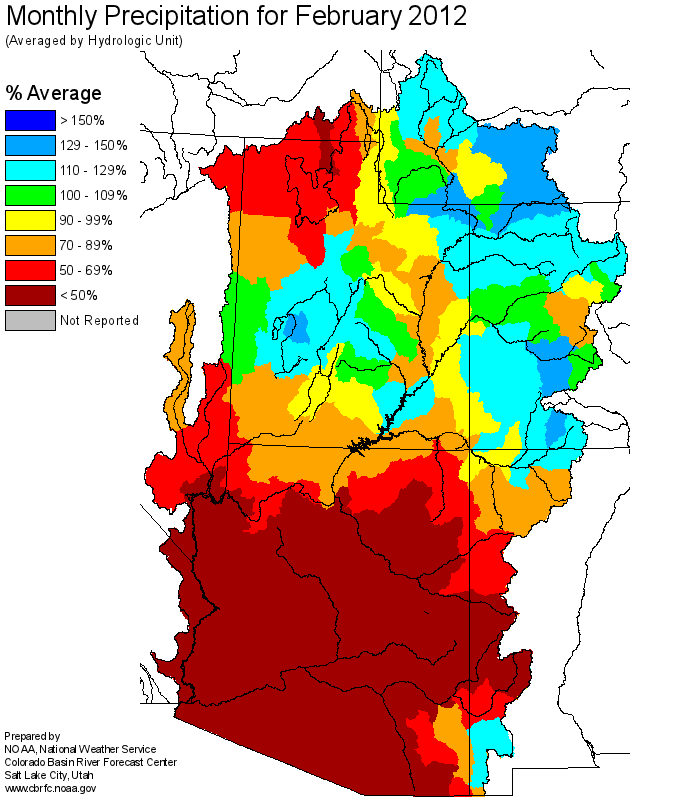
in the Upper Green basin. February precipitation was 110 percent of average.
Snow:
March 1st snow water equivalent was 105 percent of average in the basin.
--- Upper Green basin snow
water equivalent plot.
Streamflow:
February streamflow was near 110 percent of average.
Soil Moisture:
Modeled soil
moisture states indicated near average to above average soil moisture conditions
last fall prior to snow accumulation.
Climate Forecasts:
Climate forecasts were not a factor because there is not a strong correlation
between La Nina conditions and winter precipitation in the Upper Green basin.
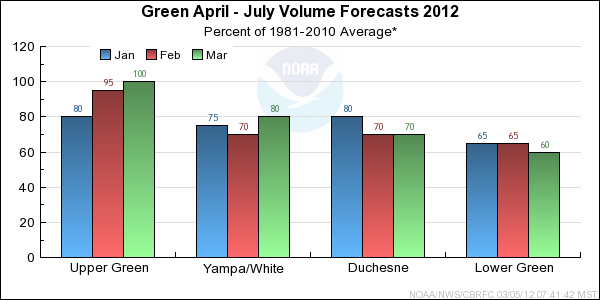
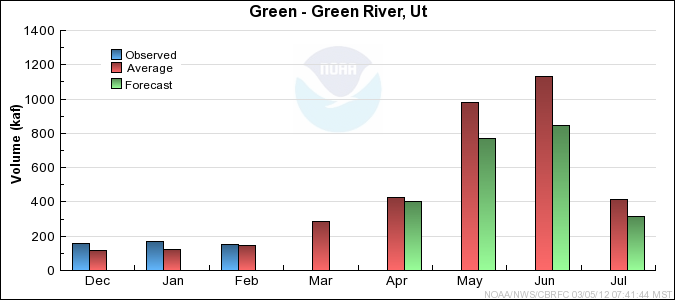
Forecast Summary:
Seasonal precipitation in the Upper Green remains near average as a result of above average precipitation for
all months except December. Snow water equivalent increased slightly from February 1st but still remains
near average. It is also important to note that fall soil moisture conditions were near to above average.
As a result, current April through July streamflow volume forecasts are similar to Februrary 1st or have increased slightly.
Forecasts now range between 80 and 103 percent of average with a median value of 100 percent.
The following conditions influenced this month's forecasts:
Precipitation:
Seasonal October through February precipitation was 80 percent of average
in the Yampa/White basin. February precipitation was near 120 percent of average.
Snow:
March 1st snow water equivalent was 80 percent of average in the basin.
--- Yampa basin snow
water equivalent plot.
Streamflow:
February streamflow was near 100 percent of average.
Soil Moisture:
Modeled soil
moisture states indicated above average to much above average soil moisture conditions
last fall prior to snow accumulation.
Climate Forecasts:
Climate forecasts were not a factor in the forecasts because there is not a strong correlation
between La Nina conditions and winter precipitation in the Yampa/White basin.
Forecast Summary:
February precipitation was above average in the Yampa/White basins. As a result of the above average conditions in February,
both the seasonal precipitation and snow water equivalent have increased from much below average to below average
conditions. It is also important to note that fall soil moisture conditions were
above to much above average. As a result of above average precipitation in February, current April through July streamflow volume
forecasts have increased by 10 to 15 percent and now range between 67 and 83 percent of average with a median value of 77 percent.
The following conditions influenced this month's forecasts:
Precipitation:
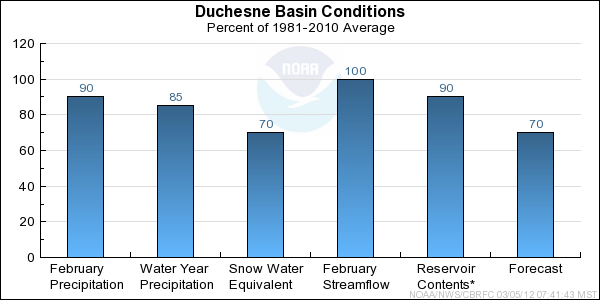
Seasonal October through February precipitation was 85 percent of average
in the Duchesne basin. February precipitation was 90 percent of average.
Snow:
March 1st snow water equivalent was 70 percent of average in the basin.
--- Duchesne basin snow
water equivalent plot.
Streamflow:
Februrary streamflow was 100 percent of average.
Soil Moisture:
Modeled soil
moisture states indicated much above average soil moisture conditions
last fall prior to snow accumulation.
Climate Forecasts:
Climate forecasts were not a factor in the forecasts because there is not a strong correlation
between La Nina conditions and winter precipitation in the Duchesne basin.
Forecast Summary:
February precipitation was near average in the Duchesne; however,
seasonal precipitation remains below average as a result of much below average and below
average conditions in December and January. Snow water equivalent still remains below average.
However, it is important to note that fall precipitation and soil moisture conditions were
much above average. Wet antecedent conditions are resulting in somewhat higher forecasts for the Whiterocks and Uinta river basins.
As a result, current April through July streamflow volume forecasts remain similar to February 1st or have decreased by 5 to 10
percent and now range between 45 and 93 percent of average with a median value of 70 percent.
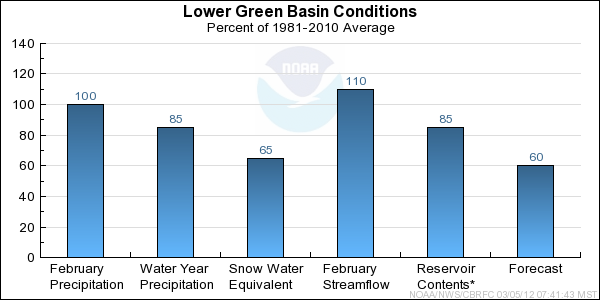
The following conditions influenced this month's forecasts:
Precipitation:
Seasonal October through February precipitation was 85 percent of average
in the Lower Green basin. February precipitation was 100 percent of average.
Snow:
March 1st snow water equivalent was 65 percent of average in the basin.
--- Lower Green basin snow
water equivalent plot.
Streamflow:
February streamflow was near 110 percent of average.
Soil Moisture:
Modeled soil
moisture states indicated near average to above average soil moisture conditions
last fall prior to snow accumulation.
Climate Forecasts:
Climate forecasts were not a factor in the forecasts because there is not a strong correlation
between La Nina conditions and winter precipitation in the Lower Green basin.
Forecast Summary:
February precipitation was near average in the Lower Green. However, seasonal precipitation and snow water equivalent remain below average
and much below average in the Lower Green due to below average monthly precipitation in November, December, and January.
It is also important to note the fall soil moisture conditions were near to above average. As a result, current April through July streamflow
volume forecasts remain similar to February 1st or have decreased slightly and range between 56 and 79 percent of average with a median value of 60 percent.
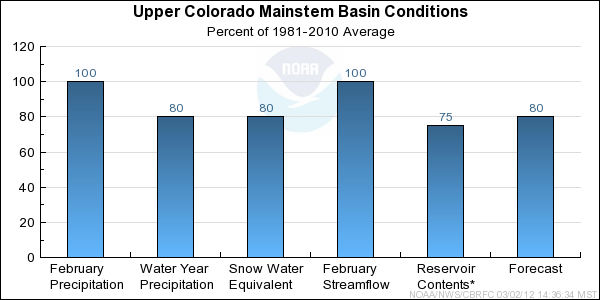
The following conditions influenced this month's forecasts:
Precipitation:
Seasonal October through February precipitation
was near 80 percent of average in the Upper Colorado mainstem basin.
Above average precipitation occured in October but was followed by
two months of much below average precipitation in November and December.
January and February precipitation was near normal.
Snow:
March 1st snow water equivalent was near 80 percent of average in the basin as a whole.
While it is still below average, it is an improvement from the 70 percent of average
observed on February 1st.
--- Upper Colorado basin snow
water equivalent plot
Streamflow:
February streamflow was near 100 percent of average.
Soil Moisture:
Modeled soil
moisture states were above average heading into the winter.
Climate Forecasts:
La Nina climate conditions exist but these do not show a strong correlation with winter
precipitation in the Upper Colorado mainstem basin, and therefore were not influential in the development
of streamflow volume forecasts.
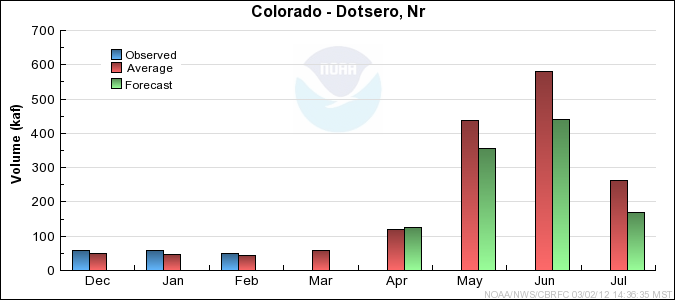
Forecast Summary:
A wet October was followed by much below average precipitation in November and Decmeber. Near average
precipitation occurred in January and February. As of March 1st both the seasonal precipitation and
basin snow water equivalent were near 80 percent of average.
Due to a very good runoff season last year and a wet October, above average soil moisture conditions
existed in the Upper Colorado mainstem heading into the winter season.
Streamflow forecasts remained the same or increased slightly from those issued last month. The biggest
change occurred in the Wolford Mountain Reservoir inflow forecast, which went from 70 percent of average
to 83 percent of average.
Current April through July streamflow volume forecasts
range between 72 and 86 percent of average with a median value of 80 percent.
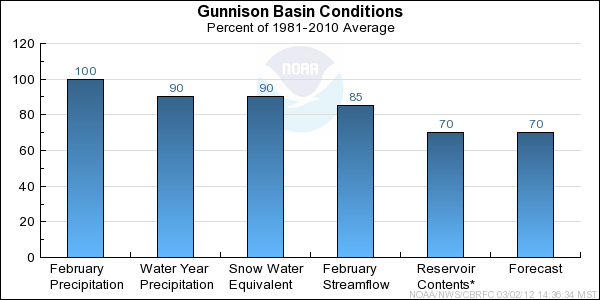
The following conditions influenced this month's forecasts:
Precipitation:
Seasonal October through February precipitation was 85 percent of
average in the Gunnison Basin. Above average precipitation occured in October.
Below average precipitation occurred in November and December with precipitation closer
to average in January.
February precipitation was below average in the East River drainage,
above average in the Uncompahgre Basin and lower Gunnison, and near average elsewhere.
Snow:
March 1st snow water equivalent was 85 percent of average in the Gunnison Basin, but varied
ranging from near 65 percent of average in the northeast part of the Gunnison Basin to
near average in the southeast part of the Basin.
Streamflow:
February streamflow volumes ranged from 85 to 95 percent of average.
Soil Moisture:
Modeled soil
moisture states were above average entering the winter season.
Climate Forecasts:
La Nina climate conditions exist but these do not show a strong correlation with winter
precipitation or Apri-July runoff volumes in the Gunnison Basin, and therefore were not
influential in the development of streamflow volume forecasts.
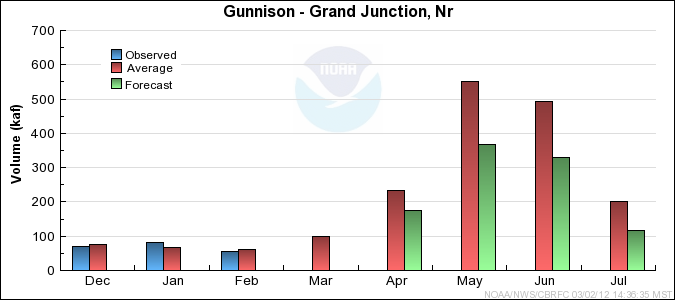
Forecast Summary:
A wet October was followed by drier condtions in November and Decmeber. Precipitation was near or above
average at most locations in January and February. Seasonal precipitation was near 85 percent of average
as of March 1st, with a basin snow water equivalent value near 85 percent of average. High runoff
in 2011 and a wet October resulted in above average soil moisture in the Gunnison Basin entering
the winter season. Streamflow runoff volume forecasts decreased slightly in the northeast headwaters
and increased slightly on some streams draining the San Juan Mountains. April-July
streamflow runoff volumes are expected to range between
60 and 90 percent of the 1981-2010 average.
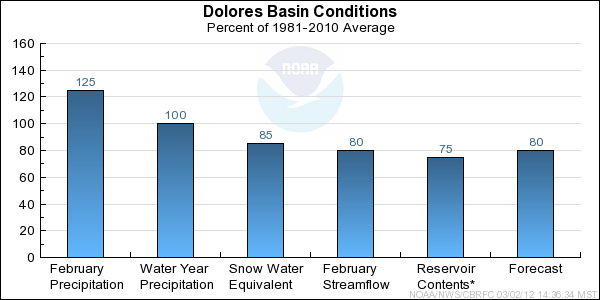
The following conditions influenced this month's forecasts:
Precipitation:
Seasonal October through February precipitation ranged between 90 and
110 percent of average. Precipitation was above average in October, much below average in November,
and near to below average in December and January.
February precipitation precipitation was above average throughout
the basin ranging from 110 to 140 percent of average.
Snow:
March 1st snow water equivalent was near 85 to 90 percent of average in the Dolores Basin.
Streamflow:
February streamflow volumes in the Dolores River Basin were near 80 percent of average.
Soil Moisture:
Modeled soil
moisture states were near average entering the winter season.
Climate Forecasts:
La Nina climate conditions exist but does not show a strong correlation with winter
precipitation or April-July runoff volumes in the Dolores Basin. Therefore, it was not
influential in the development of streamflow volume forecasts.
Forecast Summary:
Near average soil moisture existed in the Dolores River Basin entering the winter
season. Seasonal precipitation was near or slightly above average
on March 1st. Snow water equivalent increased from February 1st and was near 85
percent of average on March 1st. April-July streamflow
runoff volumes are expected to range from 75 to 85 percent of the 1981-2010 average.
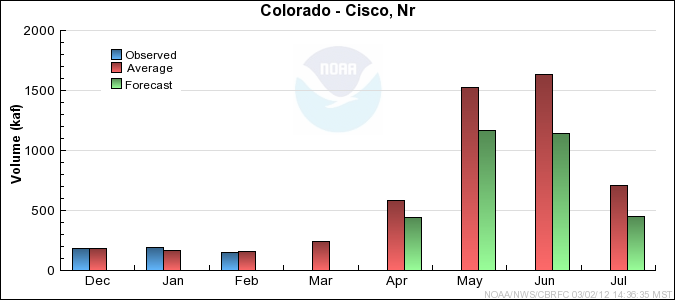
The following conditions influenced this month's forecasts:
Precipitation:
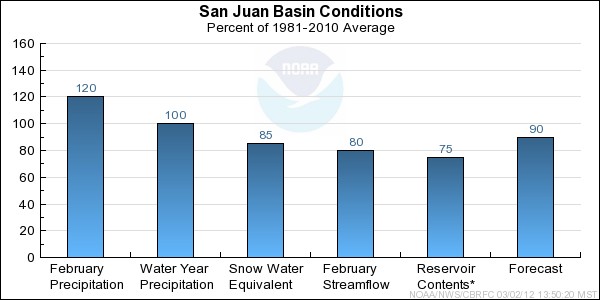
Seasonal October through February precipitation was near average in the San Juan Basin.
A wet October gave way to drier conditions November through January.
February precipitation was much above average at most locations. The February basin average
precipitation was 120 percent of average, and ranged from 90 to 150 percent of average at individual locations.
Snow:
March 1st snow water equivalent for the entire basin was near 85 percent of average, with a few sites in the 90 to 105
percent of average range.
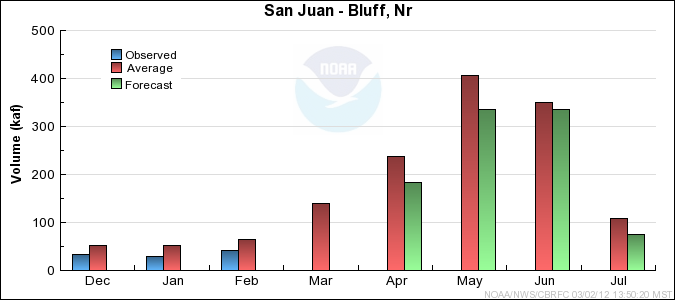
San Juan Basin (above Navajo Reservoir) Snow Plot.
Streamflow:
Streamflow volumes for February ranged from 70 to 90 percent of average.
Soil Moisture:
Modeled soil moisture was near to above
average at highest elevations entering the winter season. Below average soil moisture conditions existed
over the southern half of the basin and in tributaries further downstream.
Climate Forecasts:
La Nina climate conditions exist and a weak to moderate La Nina episode is anticipated to continue through the winter
season. The La Nina climate condition suggests drier than average conditions possible over the San Juan Basin. The
La Nina climate condition was considered when developing the forecasts.
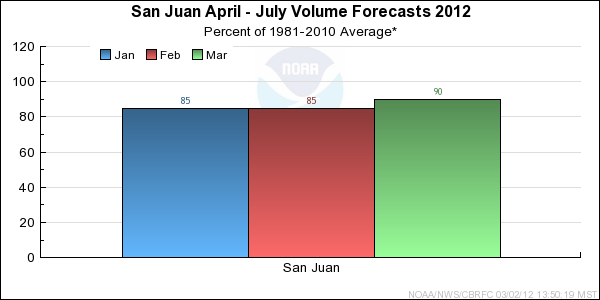
Forecast Summary:
Seasonal precipitation is near average due to a wet October and February. Snowpack conditions improved from February
1st, with snow water equivalents ranging from 70 to 105 percent of average on March 1st. Soil moisture varied
entering the winter season, with near or slightly above average conditions in high elevations in the northern headwaters,
and below average conditions elsewhere. La Nina climate conditions suggest below average precipitation is possible over
the San Juan Basin through spring. April-July runoff volumes are expected to range from 85 to 95
percent of the 1981-2010 average.
Differences between the full period forecasts and the residual forecasts may not exactly equal the actual observed volumes due to rounding conventions (see Definitions section).
Reservoir Monthly Inflow Forecasts
Green End of Month Reservoir Contents (kaf)
Usable Capacity
EOM Contents
Percent Usable Capacity
Last Year EOM
Last Year %Capacity
untitled
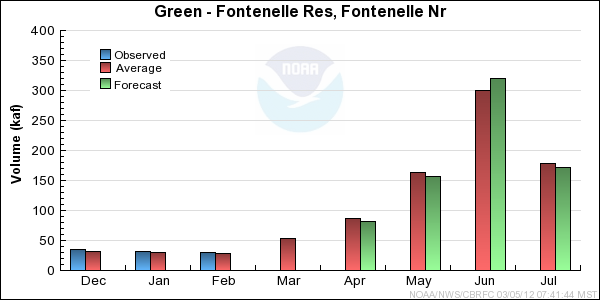
Green
Fontenelle Res, Fontenelle Nr
344.8
125.9
37
158.2
46
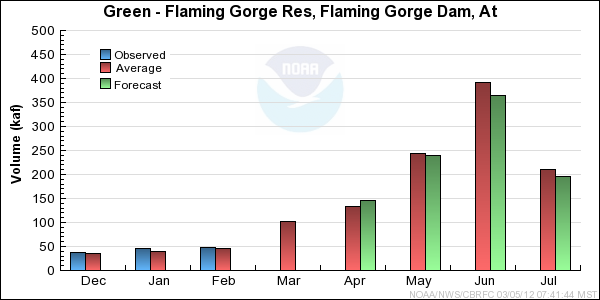
Flaming Gorge Res, Flaming Gorge Dam, At
3752.0
3288.8
88
3104.1
83
untitled
Strawberry
Solider Springs,nr
1105.9
975.0
88
976.9
88
Starvation Res, Duchesne, Nr
165.3
162.6
98
140.2
85
untitled
Price
Scofield Res, Scofield, Nr
65.8
51.8
79
26.2
40
untitled
Seeley Ck
Joes Vly Res, Orangeville, Nr
61.6
48.2
78
43.4
71
untitled
Huntington North Reservoir Storage
4.2
4.1
96
3.5
82
untitled
TOTAL
5499.6
4656.3
85
4452.6
81
Upper Colorado End of Month Reservoir Contents (kaf)
Usable Capacity
EOM Contents
Percent Usable Capacity
Last Year EOM
Last Year %Capacity
untitled
Colorado
Lake Granby, Granby, Nr
490.3
382.3
78
373.8
76
untitled
Willow Ck
Willow Ck Res, Granby, Nr
9.1
9.1
100
9.4
104
untitled
Williams Fork
Williams Fork Res, Parshall, Nr
96.9
80.5
83
80.0
83
untitled
Muddy Ck
Wolford Mountain Reservoir
66.0
58.1
88
53.9
82
untitled
Blue
Dillon Res
254.0
244.1
96
222.3
88
Green Mtn Res
146.9
82.4
56
72.9
50
untitled
Homestake Ck
Homestake Res
43.0
0.6
1
35.1
82
untitled
Frying Pan
Ruedi Res, Basalt, Nr
102.0
73.1
72
69.4
68
untitled
Plateau Ck
Vega Res, Collbran, Nr
32.9
17.5
53
13.2
40
untitled
Taylor
Taylor Park Res
106.2
65.6
62
74.0
70
untitled
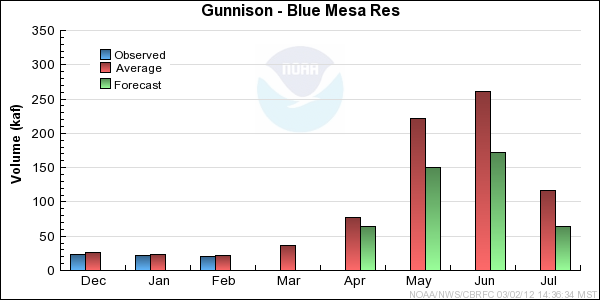
Gunnison
Blue Mesa Res
829.5
533.0
64
531.5
64
Morrow Point Res
117.0
113.2
97
110.7
95
Crystal Res
17.5
16.6
95
16.5
94
untitled
Muddy Ck
Paonia Res, Bardine, Nr
18.5
0.6
3
0.8
4
untitled
Uncompahgre
Ridgway Res
83.2
68.2
82
67.4
81
untitled
Dolores
Mcphee Res
381.1
287.7
76
273.4
72
untitled
TOTAL
2794.1
2032.5
73
2004.2
72
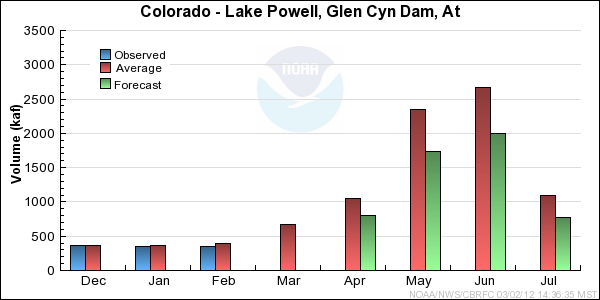
Colorado
Lake Powell
24322.0
15452.6
64
13235.0
54
untitled
TOTAL
24322.0
15452.6
64
13235.0
54
San Juan End of Month Reservoir Contents (kaf)
Usable Capacity
EOM Contents
Percent Usable Capacity
Last Year EOM
Last Year %Capacity
untitled
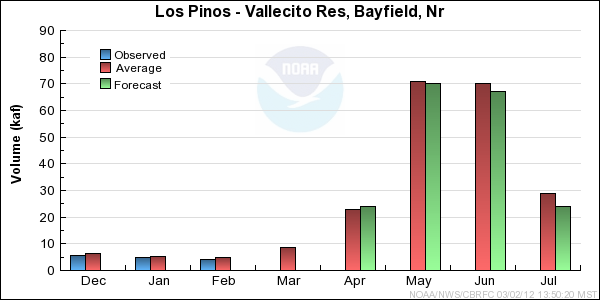
Los Pinos
Vallecito Res, Bayfield, Nr
125.4
76.4
61
72.2
58
untitled
San Juan
Navajo Res, Archuleta, Nr
1701.3
1284.9
76
1327.7
78
untitled
Florida
Lemon Res, Durango, Nr
39.8
14.0
35
14.2
36
untitled
TOTAL
1866.5
1375.3
74
1414.1
76
Monthly Streamflows
Precipitation Maps
Definitions
10% exceedance forecast: Given the current hydrometeorological conditions, i.e current snowpack, soil moisture and streamflow, the volume that has a 10% chance of being exceeded. Previously referred to as "Reasonable Maximum Forecast".
50% exceedance forecast: Given the current hydrometeorological conditions, i.e current snowpack, soil moisture and streamflow, the volume that has a 50% chance of being exceeded. Previously referred to as "Most Probable Forecast".
90% exceedance forecast: Given the current hydrometeorological conditions, i.e current snowpack, soil moisture and streamflow, the volume that has a 90% chance of being exceeded. Previously referred to as "Reasonable Minimum Forecast".
Acre-Foot (af):
The volume equal to one acre covered one foot deep (43,560 cubic feet). See kaf below.
Average:
The arithmetic mean. The sum of the values divided by the number of values. Values from 1981-2010 are used for this publication.
Categories:
Much Above Average=Greater than 130%, Above Average=111-130%, Near Average=90-110%, Below Average=70-89%, Much Below Average=Less than 70%.
CBRFC:
Colorado Basin River Forecast Center.
Forecast Period:
The period from April 1 through July 31, unless otherwise noted.
kaf:
Thousand Acre-Feet. See Acre-Foot above.
Inflow:
The volume of water that flows into a reservoir or lake.
Median:
The middle value of an ordered set of values. Half of the values are higher and half of the values are lower. When the set contains an even number of values the median is the average of the two middle numbers.
NOAA:
National Oceanic and Atomospheric Administration.
NWS:
National Weather Service.
Rounding Conventions:
Range
Round to
0-1.99
0.01
2.0-19.9
0.1
20-199
1.0
200-999
5.0
1000+
3 significant digits
Streamflow:
The volume of water that flows past a specific stream site.
Water Year:
The 12-month period, October 1 through September 30. The water year is designated by the calendar year in which it ends. Thus, the year ending September 30, 2008, is called the "2008 water year."
Additional Information
Water supply forecasts take into consideration present hydrometeorological conditions and use
average basin temperatures and precipitation for the forecast period. As the forecast season progresses,
a greater portion of the future hydrologic and climatic uncertainty becomes known and
monthly forecasts become more accurate. For more information on the tools we use, consult Water Supply Forecasting Tools.
Volume forecasts represent adjusted flows; that is, observed flows with upstream water use
taken into account. Adjusted flows will closely approximate natural or unimpaired flows.
However, not all upstream diversions or impoundments are measured or quantifiable. For specific
adjustments used with each forecast point, consult the Guide to Water Supply Forecasting.
The Water Supply Outlook is issued monthly January through May by the Colorado Basin River
Forecast Center. It represents a coordinated effort between the
National Weather Service, Natural Resources Conservation Service, Bureau of Reclamation, U.S.
Geological Survey and local water district managers.
Note: Data used in this report are provisional and are subject to revision.
For more information, or to be included on the mailing list, please contact:
Colorado Basin River Forecast Center
2242 W North Temple
Salt Lake City, UT 84116
(801) 524-5130
www.cbrfc.noaa.gov