Note: This publication is currently undergoing major revisions. The current publication will be replaced with a new publication based on stakeholder requirements and scientific advances. We expect to begin sharing details on this soon. If you have input on content, format, or publication frequency at any time, please contact us at cbrfc.webmasters@noaa.gov.Lake Powell Water Supply Outlook, April 1, 2009
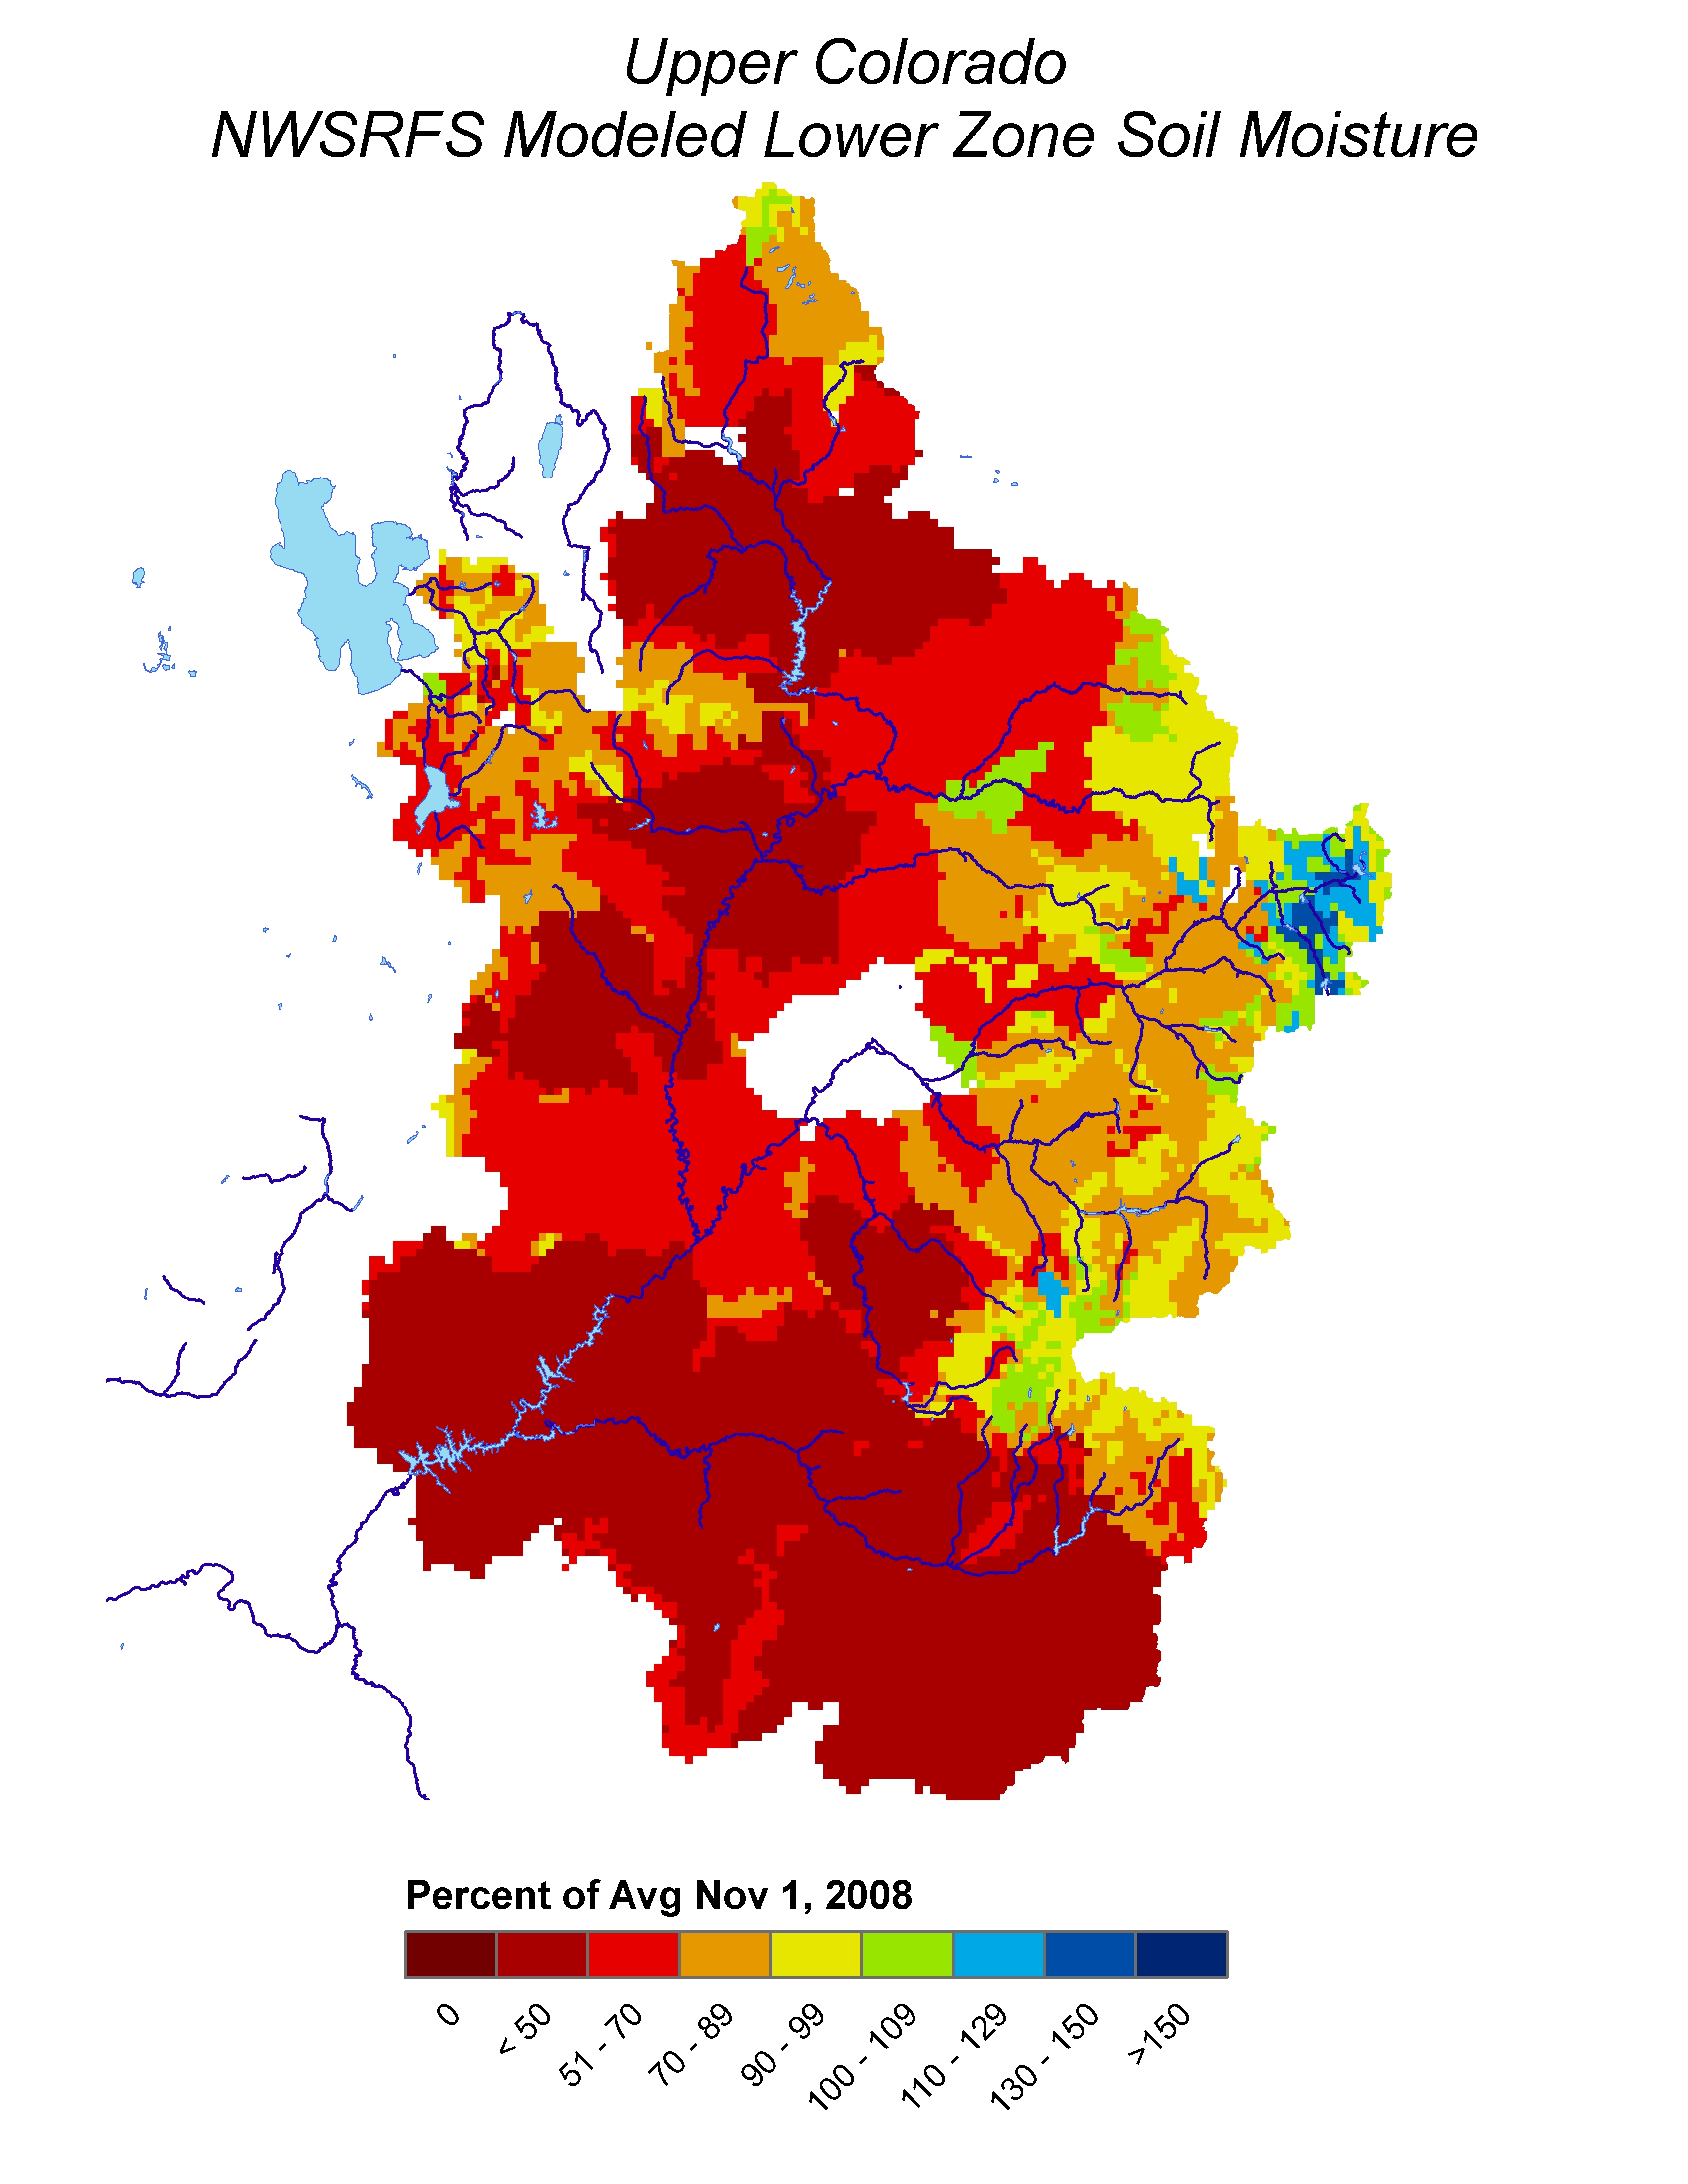
November modeled soil moisture indicated much below and below average conditions for most of Green River Basin.
(Click for November 1st image) This signal is
incorporated in the ESP model guidance utilized by
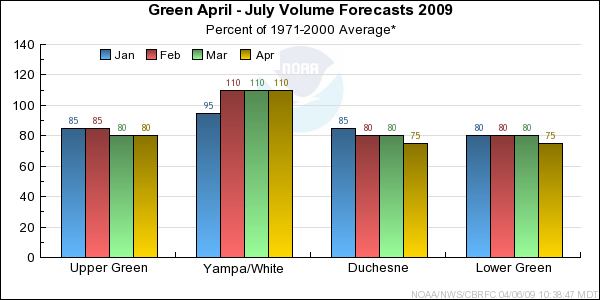
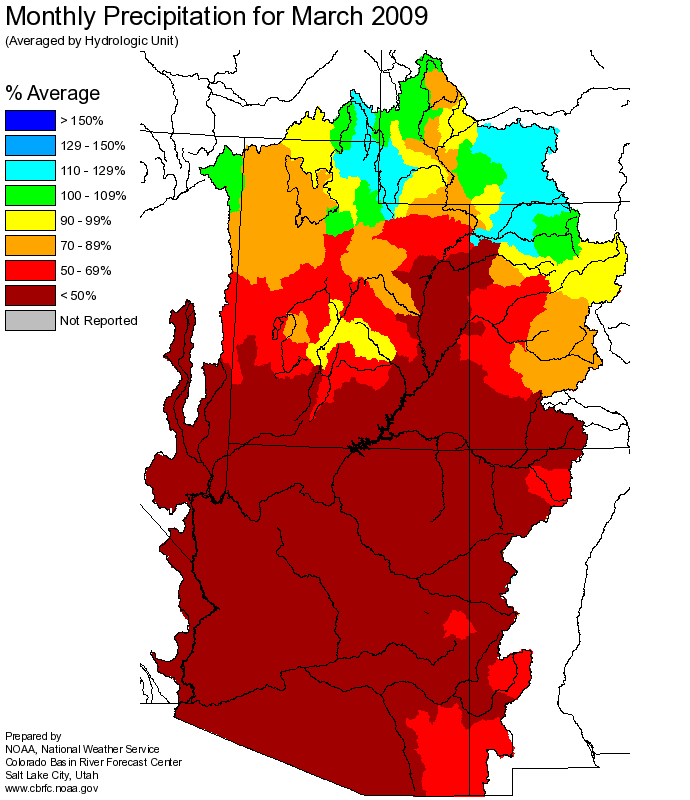
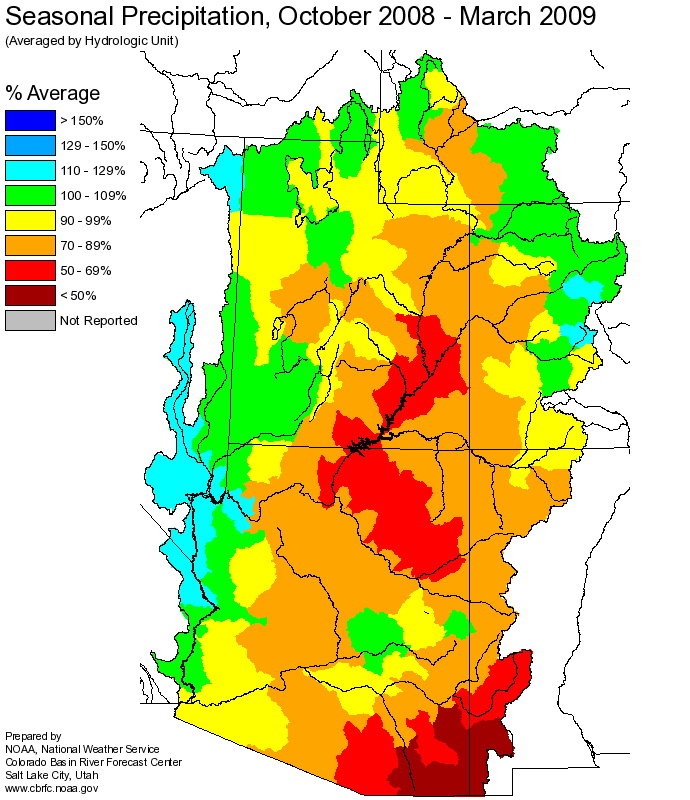
the CBRFC in generating forecasts. At the time of this publication, seasonal precipitation is near normal for most of the region. However, March
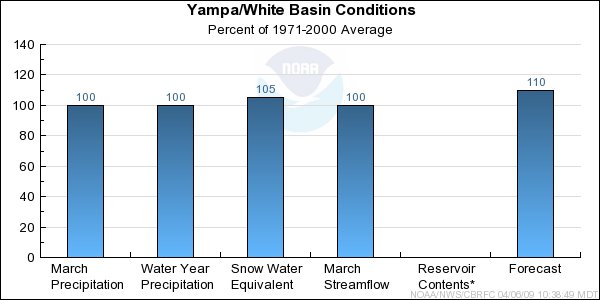
precipitation was below average in the lower basin. Snowpack ranges from near average to below average in the major tributaries of the Green River. Median April water
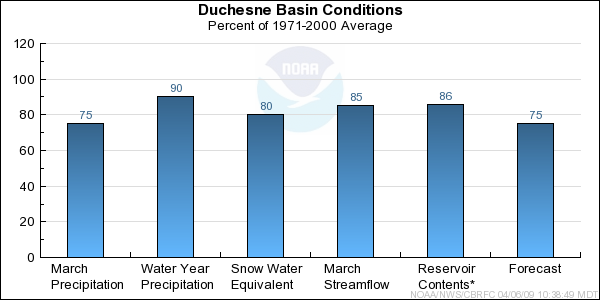
supply forecasts essentially remained the same in the Upper Green and Yampa/White River basins and dropped slighty in the Duchesne and Lower Green River basins.
*Median of forecasts within each basin.
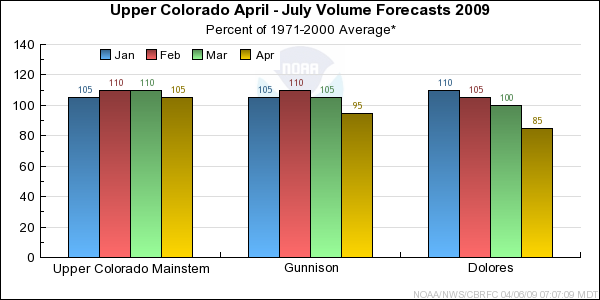
March precipitation was below average in the Upper Colorado Basin and much
below average in the Gunnison and Dolores basins. The April 1st snow water
equivalent was above average in the Upper Colorado Basin and near average in
the Gunnison and Dolores basins; this is a decrease in the snow water
equivalent percent of average in all basins from March 1st with the largest
drop having occurred in the Dolores basin. The decreases in the forecasts
from last month for each basin generally follow the decreases in the snow
water equivalent percent of average.
*Median of forecasts within each basin.
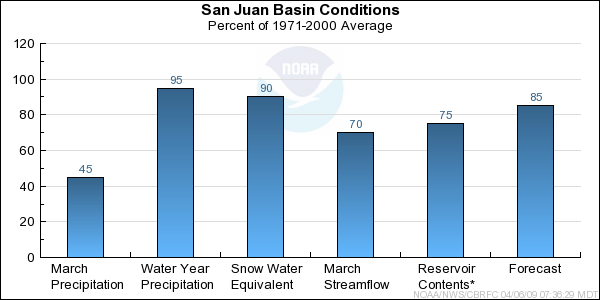
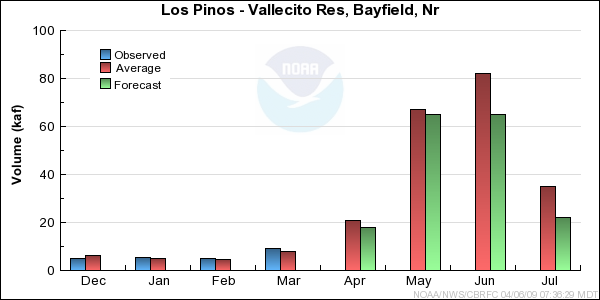
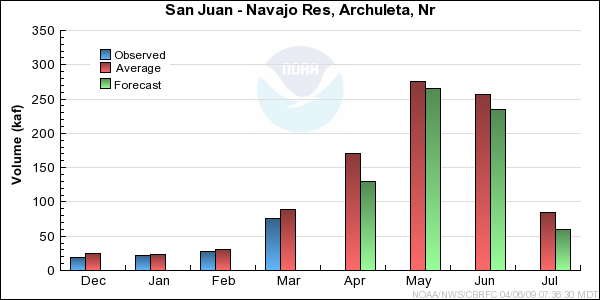
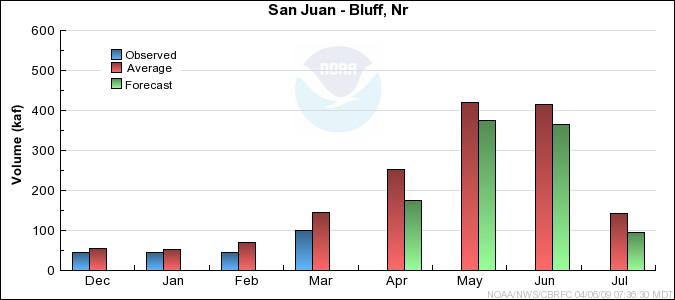
-Model Soil Moisture/Observed Streamflow...Soil moisture
for most of the upper basins in the San Juan were below average last fall. This was most likely due
to limited monsoonal precipitation over the summer months. Observed streamflow for the month of March
was mostly below average for the lower San Juan while the upper portions saw
above to much above average flows due to
above normal temperatures in early March.
-Snowpack/Precipitation...Snow water equivalent
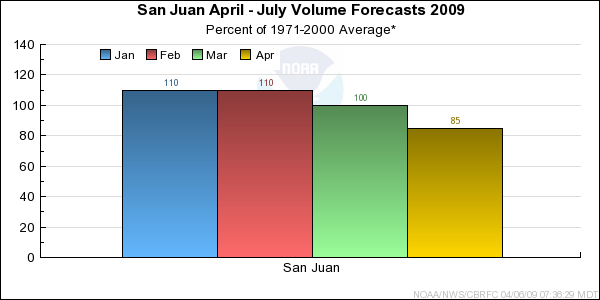
for the entire San Juan Basin on April 1st was 90 percent of average.
Precipitation over the San Juan Basin for March was a dismal 45% of average. Because of this, seasonal
precipitation for the San Juan Basin dropped to 95 percent of average.
-Short Term Precipitation Forecast...The forecast models through the middle of April suggest a slight probability of above
average precipitation for the San Juan Basin.
-General Discussion...Due to the below average soil moiture in the upper basin this fall and the combination of current snowpack
conditions and low March monthly precipitation, the median April-July forecast for the San Juan Basin is 85 percent of average. This is a 15 percent drop
from last month's forecast.
*Median of forecasts within each basin.
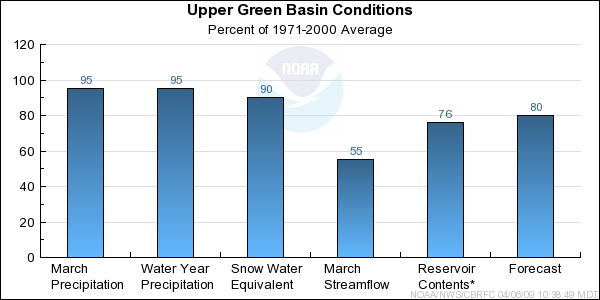
Upper Green Basin Conditions
-Model Soil Moisture/Observed Streamflow...The November soil
moisture conditions were much below average in the Upper Green River basin. Observed streamflow for the month of March was 55 percent of average.
-Snowpack/Precipitation...In the Upper Green River basin, March precipitation was 95 percent of average. On April 1st, the basinwide snowpack
was 90 percent of average.
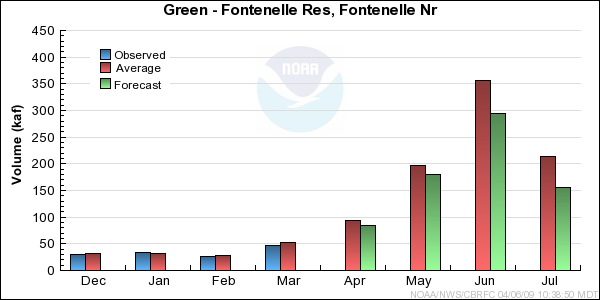
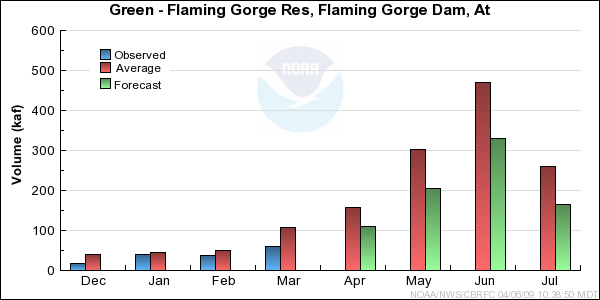
-General Discussion...Weather models suggest slightly above normal precipitation for the next 8-14 days. Beyond that the 30 Day CPC guidance shows equal chances for
above, normal, or below average precipitation. April through July guidance indicate much below average to average runoff volumes for points above Flaming Gorge.
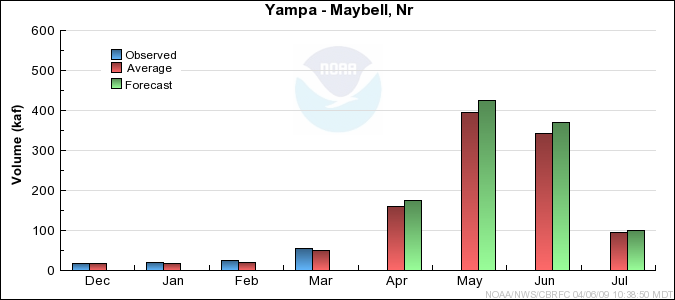
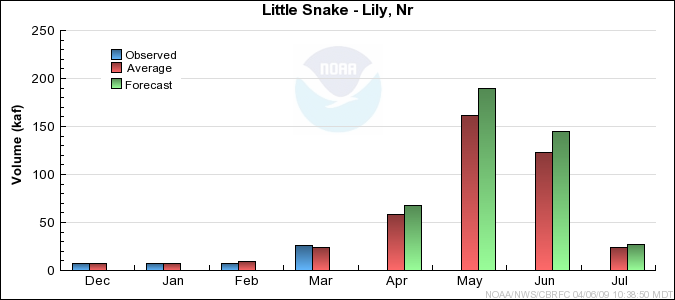
-Model Soil Moisture/Observed Streamflow...Fall soil moisture
estimates were near average in the headwaters of the Yampa and White River basin. Soil moisture deficits are not adversely effecting model guidance as much as in other regions. Observed streamflow for the month of March was average.
-Snowpack/Precipitation...Currently, the Yampa and White River basin has the highest snowpack conditions
within the Green River Basin. On April 1st, individual Snotel stations SWE values ranged from 80 to 145 percent of average. March precipitation was average.
-General Discussion...Weather models suggest slightly above normal precipitation for the next 8-14 days. Beyond that the 30 Day CPC guidance shows equal chances for above,
normal, or below average precipitation. April through July guidance indicate runoff volumes from average to above average for the Yampa and White River basin.
-Model Soil Moisture/Observed Streamflow...Fall soil conditions in the Duchesne were similar to the Upper Green with many basins indicating much below
average conditions. Observed streamflow for the months of February and March was below average.
-Snowpack/Precipitation...The snowpack
in the Duchesne River basin on April 1st was 80 percent of average, with most of the Snotel stations reporting below average conditions. March precipitation was 75 percent of average.
-General Discussion...Weather models suggest slightly above normal precipitation for the next 8-14 days. Beyond that the 30 Day CPC guidance shows equal chances for above,
normal, or below average precipitation. Forecasts range below average in the headwaters of the basin to much below average at downstream locations.
-Model Soil Moisture/Observed Streamflow...The November soil
moisture conditions were much below average in the Lower Green River basin and continues to drive lower model guidance. Observed streamflow for the months of February and March was below average.
-Snowpack/Precipitation...The Lower Green River basin
snowpack was 75 percent of average on April 1st. March precipitation was 80 percent of average.
-General Discussion...Weather models suggest slightly above normal precipitation for the next 8-14 days. Beyond that the 30 Day CPC guidance shows equal chances for above,
normal, or below average precipitation. Forecasts remain below average, with the exception of Ferron Creek forecasted at much below average.
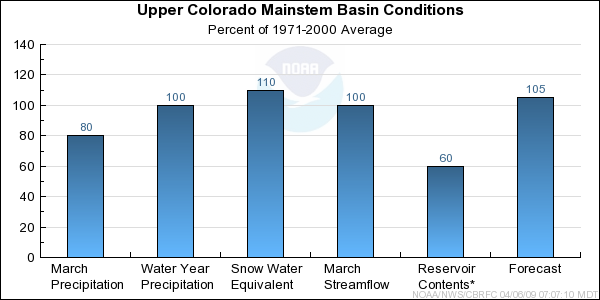
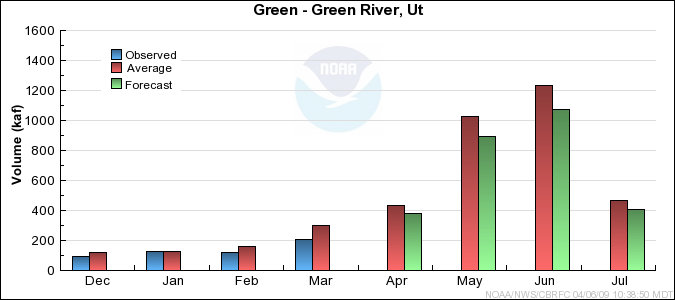
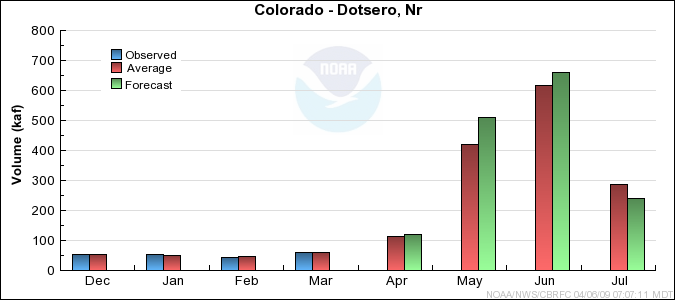
-Model Soil Moisture/Observed Streamflow... Soil moisture
was near to above average in the Upper Colorado heading into the winter.
March streamflow was near average.
-Snowpack/Precipitation... March precipitation was 80% of average in the Upper
Colorado River Basin, making it two months in a row with below average
precipitation. However, the seasonal precipitation is still near average and
the snow
water equivalent was still just above average at 110% as of April 1st.
-Short Term Precipitation Forecast... The forecast models through the middle
of April suggest that the Upper Colorado Basin will see above average
precipitation.
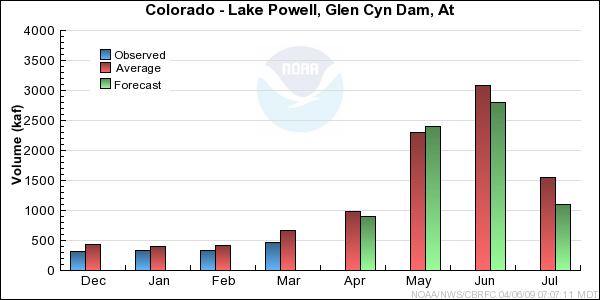
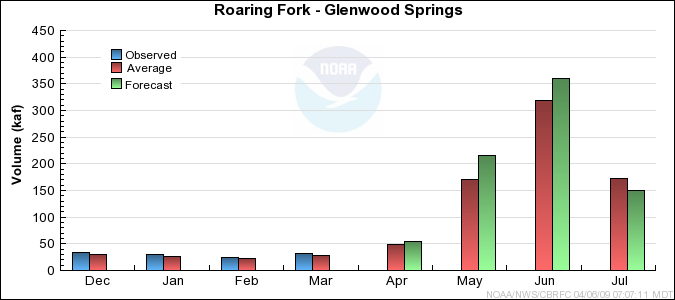
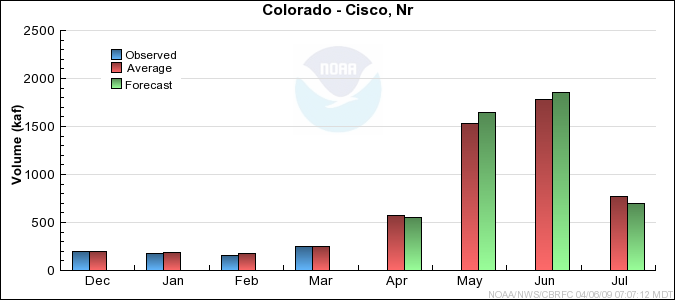
-General Discussion... In general, forecasts were dropped about 5% from last
month due to the below average precipitation and the decrease in the snow water
equivalent percent of average. Larger drops occurred in the lower part of the
basin where the forecasts for Plateau Creek, Colorado near Cisco and Lake Powell
had decreases closer to 10% of average. The Mill Creek forecast had the biggest
decline going from 96% of average to 70% of average due to the loss of snow in
that area. The April through July streamflow volume forecasts now range between
70% and 114% of average, with a median value of 105%.
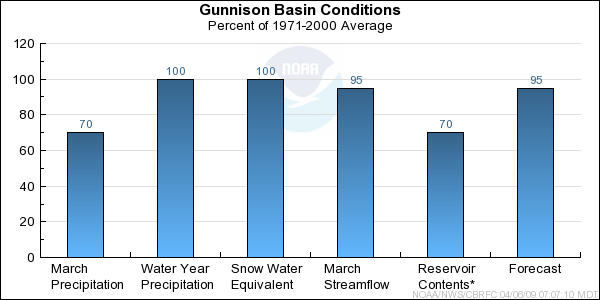
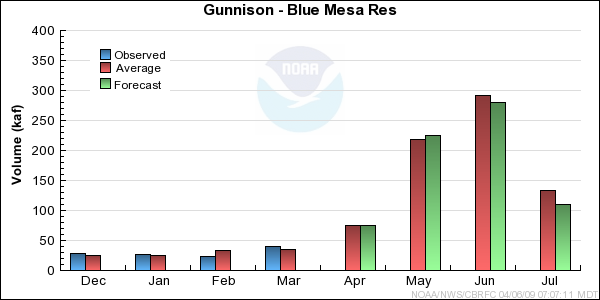
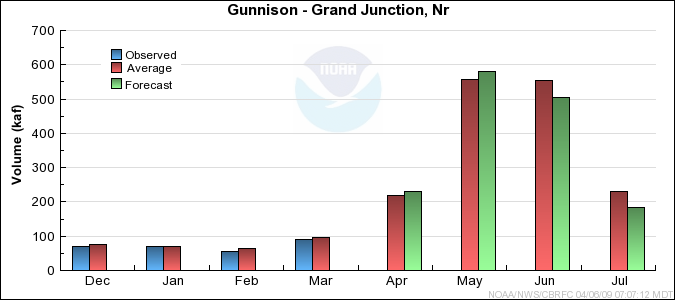
-Model Soil Moisture/Observed Streamflow...Soil moisture
for most of the upper basins in the Gunnison was near to slightly below average in the fall. Observed
streamflow for the month of March was near average for the Gunnison.
-Snowpack/Precipitation...Precipitation over the Gunnison Basin
for March was below average at 70 percent. The April 1st snow
water equivalent
percent of average was 100 percent, which dropped about 5 percent from March 1st. Seasonal precipitation for the Gunnison is 100 percent of average.
-Short Term Precipitation Forecast...The forecast models through the middle of April suggest that the Gunnison Basin will see above average
precipitation.
-General Discussion...Due to the average soil moiture in the upper basin this fall, the current
snowpack conditions, and the below average precipitation in March, the median April-July forecast for the Gunnison Basin is 95 percent of
average. This is down 10 percent from last month's forecast.
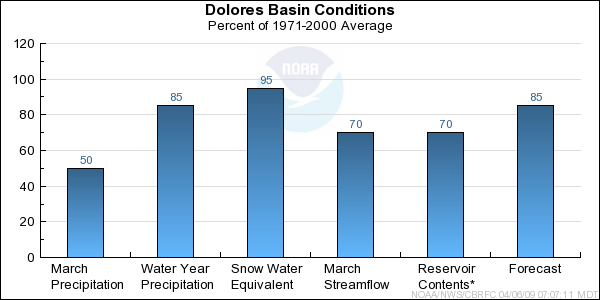
-Model Soil Moisture/Observed Streamflow...Soil moisture
for most of the upper basins in the Dolores was below average in the fall. This was most likely due to
limited monsoonal precipitation during the summer months. Observed streamflow for the month of March was
average to below average for the Dolores.
-Snowpack/Precipitation...As of April 1st, snow water equivalent
across the Dolores was 95 percent of average, which was about a 15 percent drop from March 1st. Precipitation over the Dolores Basin for
March was much below average with 50 percent. Seasonal precipitation for the
Dolores Basin dropped to 85 percent of average.
-Short Term Precipitation Forecast...The forecast models through the middle of April suggest above average precipitation.
-General Discussion...Due to the combination of below average soil moiture in the upper basin this fall, current snowpack conditions, above normal temperatures in early March,
and the much below average precipitation in March, the median April-July forecast for the Dolores Basin
is 85 percent of average. This is down 20 percent from last month's forecast.
Differences between the full period forecasts and the residual forecasts may not exactly equal the actual observed volumes due to rounding conventions (see Definitions section).
Reservoir Monthly Inflow Forecasts
Green Reservoir Contents (kaf)
Usable Capacity
EOM Contents
Percent Usable Capacity
Last Year EOM
Last Year %Capacity
untitled
Green
Fontenelle Res, Fontenelle Nr
344.8
110.7
32
99.8
29
Flaming Gorge Res, Flaming Gorge Dam, At
3749.0
2986.0
80
3034.7
81
untitled
Strawberry
Strawberry Res
1105.9
940.2
85
879.8
80
Starvation Res, Duchesne, Nr
165.3
158.5
96
152.2
92
untitled
Price
Scofield Res, Scofield, Nr
65.8
22.0
33
14.0
21
untitled
Seeley Ck
Joes Vly Res, Orangeville, Nr
61.6
39.1
63
42.4
69
untitled
Huntington North Reservoir Storage
4.2
4.2
99
3.3
79
untitled
TOTAL
5496.6
4260.7
78
4226.2
77
Upper Colorado Reservoir Contents (kaf)
Usable Capacity
EOM Contents
Percent Usable Capacity
Last Year EOM
Last Year %Capacity
untitled
Colorado
Lake Granby, Granby, Nr
490.3
233.8
48
230.4
47
untitled
Willow Ck
Willow Ck Res, Granby, Nr
9.1
9.2
101
7.6
84
untitled
Williams Fork
Williams Fork Res, Parshall, Nr
96.9
79.6
82
81.5
84
untitled
Wolford Mountain Reservoir
66.0
51.8
78
51.0
77
untitled
Blue
Dillon Res
254.0
222.8
88
233.5
92
Green Mtn Res
146.9
63.3
43
64.1
44
untitled
Homestake Ck
Homestake Res
43.0
24.1
56
35.6
83
untitled
Frying Pan
Ruedi Res, Basalt, Nr
102.0
68.1
67
63.0
62
untitled
Plateau Ck
Vega Res, Collbran, Nr
32.9
15.5
47
16.8
51
untitled
Taylor
Taylor Park Res
106.2
71.0
67
75.2
71
untitled
Gunnison
Blue Mesa Res
829.5
542.8
65
439.2
53
Morrow Point Res
117.0
107.3
92
113.1
97
Crystal Res
17.5
16.5
94
16.0
91
untitled
Muddy Ck
Paonia Res, Bardine, Nr
18.5
2.0
11
1.7
9
untitled
Uncompahgre
Ridgway Res
83.2
70.6
85
64.8
78
untitled
Dolores
Mcphee Res
381.1
283.2
74
298.4
78
untitled
TOTAL
2794.1
1861.5
67
1791.8
64
Colorado
Lake Powell
24322.0
12773.6
53
10799.7
44
untitled
TOTAL
24322.0
12773.6
53
10799.7
44
San Juan Reservoir Contents (kaf)
Usable Capacity
EOM Contents
Percent Usable Capacity
Last Year EOM
Last Year %Capacity
untitled
Los Pinos
Vallecito Res, Bayfield, Nr
125.4
80.6
64
39.2
31
untitled
San Juan
Navajo Res, Archuleta, Nr
1701.3
1287.1
76
1321.5
78
untitled
Florida
Lemon Res, Durango, Nr
39.8
19.5
49
23.6
59
untitled
TOTAL
1866.5
1387.3
74
1384.3
74
Monthly Streamflows
Precipitation Maps
Definitions
10% exceedance forecast: Given the current hydrometeorological conditions, i.e current snowpack, soil moisture and streamflow, the volume that has a 10% chance of being exceeded. Previously referred to as "Reasonable Maximum Forecast".
50% exceedance forecast: Given the current hydrometeorological conditions, i.e current snowpack, soil moisture and streamflow, the volume that has a 50% chance of being exceeded. Previously referred to as "Most Probable Forecast".
90% exceedance forecast: Given the current hydrometeorological conditions, i.e current snowpack, soil moisture and streamflow, the volume that has a 90% chance of being exceeded. Previously referred to as "Reasonable Minimum Forecast".
Acre-Foot (af):
The volume equal to one acre covered one foot deep (43,560 cubic feet). See kaf below.
Average:
The arithmetic mean. The sum of the values divided by the number of values. Values from 1971-2000 are used for this publication.
Categories:
Much Above Average=Greater than 130%, Above Average=111-130%, Near Average=90-110%, Below Average=70-89%, Much Below Average=Less than 70%.
CBRFC:
Colorado Basin River Forecast Center.
Forecast Period:
The period from April 1 through July 31, unless otherwise noted.
kaf:
Thousand Acre-Feet. See Acre-Foot above.
Inflow:
The volume of water that flows into a reservoir or lake.
Median:
The middle value of an ordered set of values. Half of the values are higher and half of the values are lower. When the set contains an even number of values the median is the average of the two middle numbers.
NOAA:
National Oceanic and Atomospheric Administration.
NWS:
National Weather Service.
Rounding Conventions:
Range
Round to
0-1.99
0.01
2.0-19.9
0.1
20-199
1.0
200-999
5.0
1000+
3 significant digits
Streamflow:
The volume of water that flows past a specific stream site.
Water Year:
The 12-month period, October 1 through September 30. The water year is designated by the calendar year in which it ends. Thus, the year ending September 30, 2008, is called the "2008 water year."
Additional Information
Water supply forecasts take into consideration present hydrometeorological conditions and use
average basin temperatures and precipitation for the forecast period. As the forecast season progresses,
a greater portion of the future hydrologic and climatic uncertainty becomes known and
monthly forecasts become more accurate. For more information on the tools we use, consult Water Supply Forecasting Tools.
Volume forecasts represent adjusted flows; that is, observed flows with upstream water use
taken into account. Adjusted flows will closely approximate natural or unimpaired flows.
However, not all upstream diversions or impoundments are measured or quantifiable. For specific
adjustments used with each forecast point, consult the Guide to Water Supply Forecasting.
The Water Supply Outlook is issued monthly January through May by the Colorado Basin River
Forecast Center. It represents a coordinated effort between the
National Weather Service, Natural Resources Conservation Service, Bureau of Reclamation, U.S.
Geological Survey and local water district managers.
Note: Data used in this report are provisional and are subject to revision.
For more information, or to be included on the mailing list, please contact:
Colorado Basin River Forecast Center
2242 W North Temple
Salt Lake City, UT 84116
(801) 524-5130
www.cbrfc.noaa.gov

