New 1981-2010 Averages being used this year.
Note: This publication is currently undergoing major revisions. The current publication will be replaced with a new publication based on stakeholder requirements and scientific advances. We expect to begin sharing details on this soon. If you have input on content, format, or publication frequency at any time, please contact us at cbrfc.webmasters@noaa.gov.Lake Powell Water Supply Outlook, April 1, 2012Lake Powell Water Supply Outlook, April 1, 2012
Contents
Lake Powell Sub-Basin Summaries

*Median of forecasts within each basin.
*Median of forecasts within each basin.
*Median of forecasts within each basin.
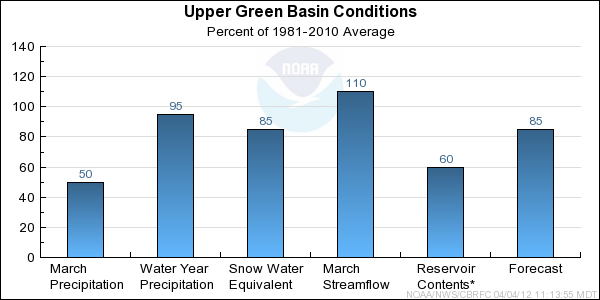
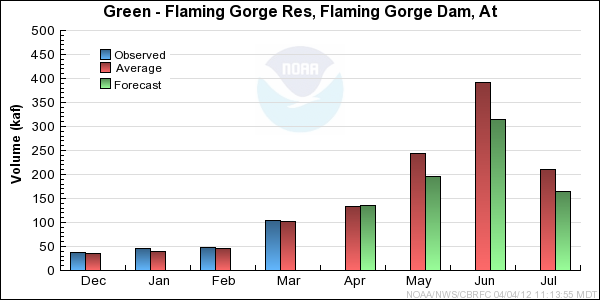
Upper Green Basin Conditions
The following conditions influenced this month's forecasts:
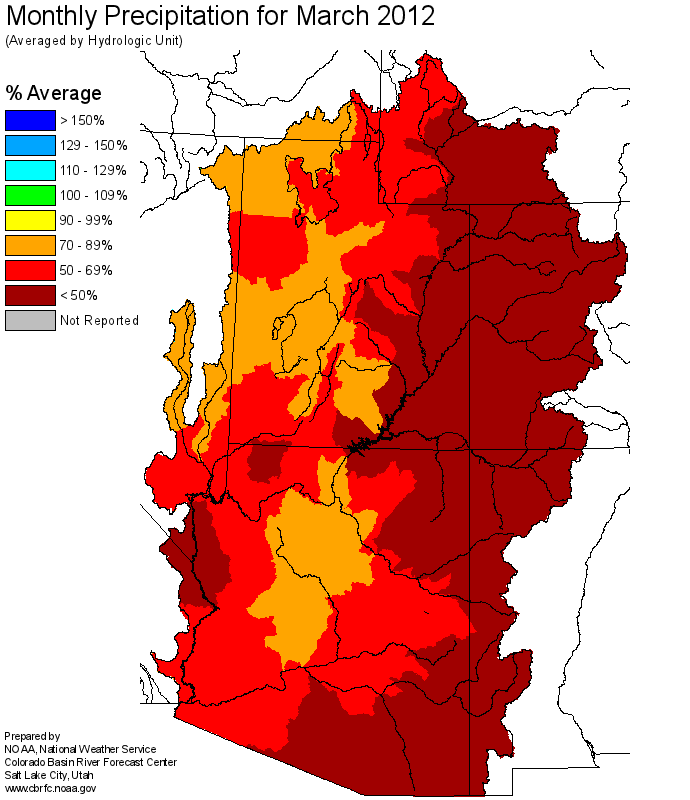
Precipitation:
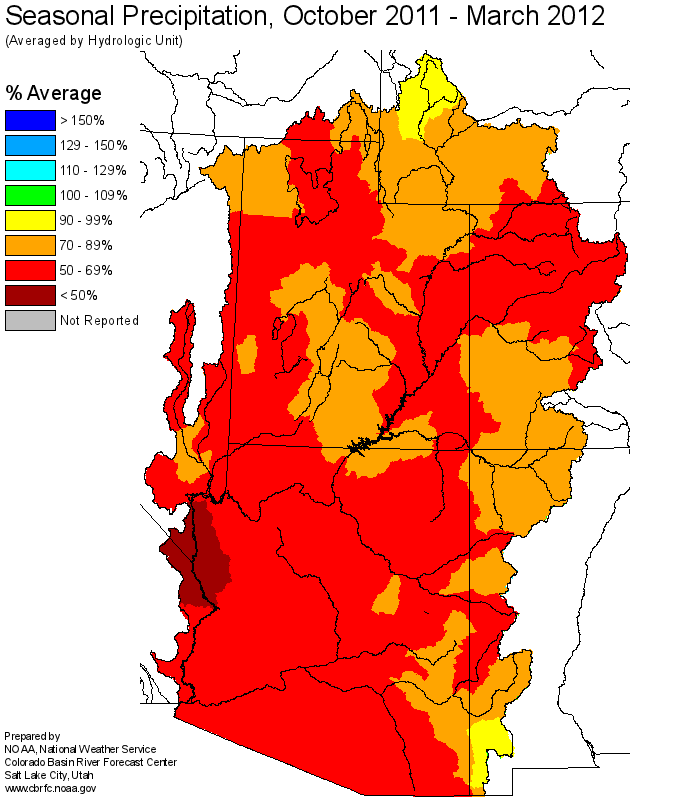
Seasonal October through March
precipitation was 95 percent of average
in the Upper Green basin as a whole. March
precipitation was 50 percent of average.
Snow:
April 1st snow water equivalent was 85 percent of average in the basin as a whole. Low and mid elevation snowmelt
occurred due to much above average temperatures in March.
--- Upper Green basin
snow
water equivalent plot.
Streamflow:
March streamflow was near 110 percent of average.
Soil Moisture:
Modeled
soil
moisture states indicated near average to above average soil moisture conditions
last fall prior to snow accumulation.
Climate Forecasts:
Climate forecasts were not a factor because there is not a strong correlation
between La Nina conditions and winter precipitation in the Upper Green basin.
Forecast Summary:
March precipitation was much below average; however, seasonal precipitation in the Upper Green remains near average
as a result of above average precipitation in months other than December and March. As a result of early snowmelt
and much below average precipitation during March, the snow water equivalent decreased from near average to below average.
As a result, current April through July streamflow volume forecasts in the headwaters of the Upper Green have
decreased by 5 to 10 percent while forecasts for basins located in the Wyoming range (Ham's Fork) or the North Slope of the
Uintas decreased by 15 to 20 percent. Forecasts now range between 60 and 99 percent of average with a median value of 86 percent.
* Percent usable capacity, not percent average contents.
Click for multi-month Graph.
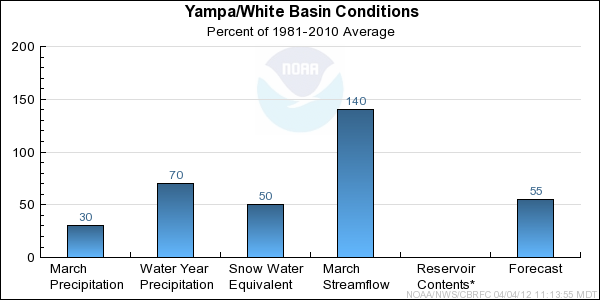
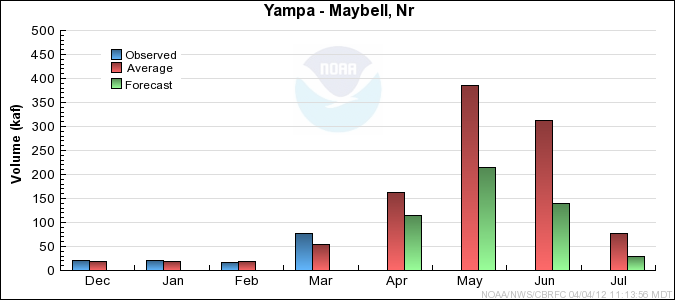
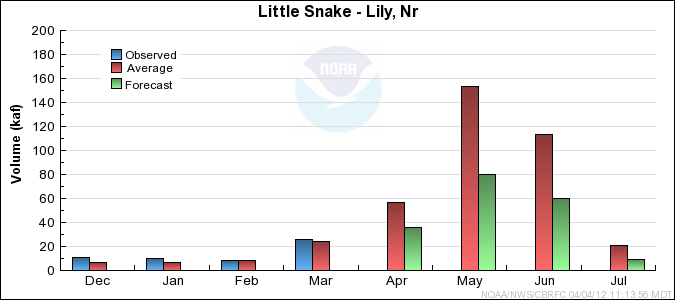
Yampa/White Basin Conditions
The following conditions influenced this month's forecasts:
Precipitation:
Seasonal October through March
precipitation was 70 percent of average
in the Yampa/White basin. March
precipitation was near 30 percent of average. This is the driest March on record for many
of the SNOTEL sites in the basin.
Snow:
April 1st snow water equivalent was 50 percent of average in the basin. Significant snowmelt occurred at low and mid elevations due to
much above average temperatures in March.
--- Yampa basin
snow
water equivalent plot.
Streamflow:
March streamflow was 140 percent of average as a result of the early snowmelt.
Soil Moisture:
Modeled
soil
moisture states indicated above average to much above average soil moisture conditions
last fall prior to snow accumulation.
Climate Forecasts:
Climate forecasts were not a factor in the forecasts because there is not a strong correlation
between La Nina conditions and winter precipitation in the Yampa/White basin.
Forecast Summary:
Due to much below average March precipitation, seasonal precipitation is now below average in the Yampa/White. Significant
snowmelt occurred during March due to the warm and dry conditions. By April 1st, the snow water equivalent had
been reduced from 80 percent of average on March 1st to near 50 percent of average. Many
of the SNOTEL locations have record or near record low snow water equivalent for this time of year.
As a result of the unusual dry and warm conditions in March, current April through July streamflow
volume forecasts have drastically decreased by 25 to 40 percent with the greatest decreases occurring in the Elkhead and Little
Snake basins. Forecasts now range between 38 and 59 percent of average with a median value of 54 percent.
* Percent usable capacity, not percent average contents.
Click for multi-month Graph.
Duchesne Basin Conditions
The following conditions influenced this month's forecasts:
Precipitation:
Seasonal October through March
precipitation was 80 percent of average
in the Duchesne basin. March
precipitation was 60 percent of average.
Snow:
April 1st snow water equivalent was 55 percent of average in the basin. Low and mid elevation snowmelt
occurred due to much above average temperatures in March.
--- Duchesne basin
snow
water equivalent plot.
Streamflow:
March streamflow was near 120 percent of average over the basin.
Soil Moisture:
Modeled
soil
moisture states indicated much above average soil moisture conditions
last fall prior to snow accumulation.
Climate Forecasts:
Climate forecasts were not a factor in the forecasts because there is not a strong correlation
between La Nina conditions and winter precipitation in the Duchesne basin.
Forecast Summary:
March precipitation was much below average in the Duchesne and seasonal precipitation
still remains below average. Significant snowmelt occurred below 9000 feet due to the warm and dry
conditions in March. As of April 1st, the snow water equivalent over the basin as a whole had
been reduced from 70 percent of average on March 1st to 50 percent of average.
As a result, current April through July streamflow volume forecasts decreased by 5 to
10 percent in the higher elevation basins and by 20 to 30 percent in lower elevation basins such as Currant
Creek, Strawberry, and Big Brush drainages. Forecasts now range between 29 and 78 percent
of average with a median value of 62 percent.

* Percent usable capacity, not percent average contents.
Click for multi-month Graph.
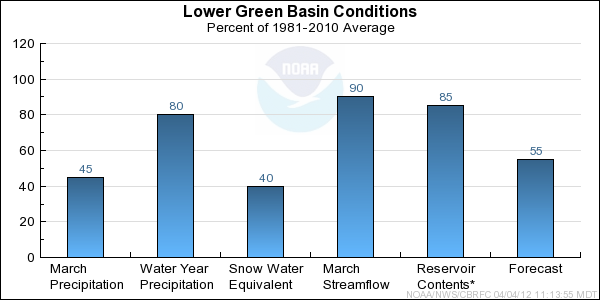
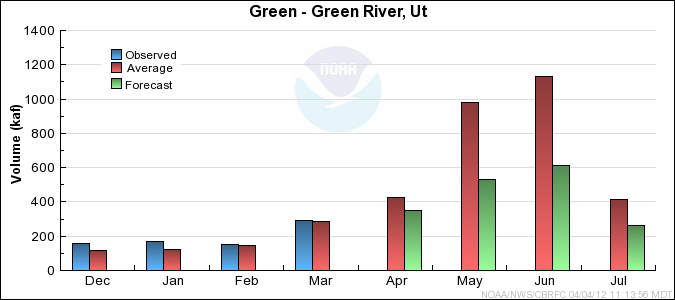
Lower Green Basin Conditions
The following conditions influenced this month's forecasts:
Precipitation:
Seasonal October through March
precipitation was 80 percent of average
in the Lower Green basin. March
precipitation was 45 percent of average.
Snow:
April 1st snow water equivalent was 40 percent of average in the basin. Significant snowmelt
occurred due to much above average temperatures in March.
--- Lower Green basin
snow
water equivalent plot.
Streamflow:
March streamflow was near 90 percent of average.
Soil Moisture:
Modeled
soil
moisture states indicated near average to above average soil moisture conditions
last fall prior to snow accumulation.
Climate Forecasts:
Climate forecasts were not a factor in the forecasts because there is not a strong correlation
between La Nina conditions and winter precipitation in the Lower Green basin.
Forecast Summary:
March precipitation was much below average in the Lower Green and seasonal precipitation remains below average.
As a result of the snowmelt during March, the snow water equivalent is now much below average and
has been reduced from 65 percent on March 1st to 40 percent of average. As a result, current April through July streamflow
volume forecasts have decreased by 10 to 20 percent and now range between 39 and 59 percent of average
with a median value of 53 percent.
* Percent usable capacity, not percent average contents.
Click for multi-month Graph.
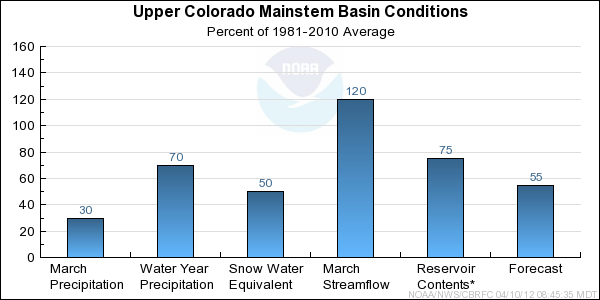
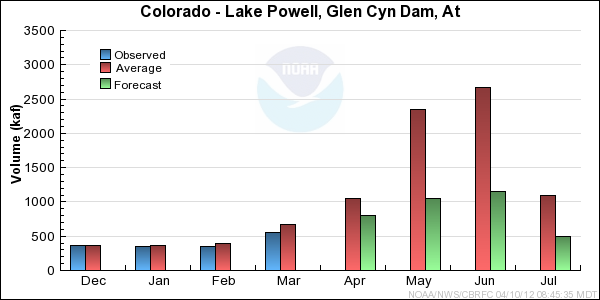
Upper Colorado Mainstem Basin Conditions
The following conditions influenced this month's forecasts:
Precipitation:
Seasonal October through March
precipitation
was near 70 percent of average in the Upper Colorado mainstem basin.
March
precipitation was much below average at
just 30 percent of average. This is the driest March on record at
many of the SNOTEL sites in the basin.
Snow:
April 1st snow water equivalent was near 50 percent of average in the basin as a whole.
In a normal year snow continues to accumulate through March, and into the middle of April
at higher elevations. However this year melt occurred during March,
especially toward the end of the month and even at SNOTEL sites above 11,000 feet.
The April 1 snow water equivalent values are the lowest on record at many of the
SNOTEL sites in the basin.
--- Upper Colorado basin
snow
water equivalent plot
Streamflow:
March streamflow was near 120 percent of average in the basin as a whole.
It ranged from 110 percent to 220 percent of average at individual sites.
The March volume at about one third of the forecast points in the Upper
Colorado basin ranked in the top three of their historical records.
Soil Moisture:
Modeled
soil
moisture states were above average heading into the winter.
Climate Forecasts:
La Nina climate conditions exist but these do not show a strong correlation with winter
precipitation in the Upper Colorado mainstem basin, and therefore were not influential in the development
of streamflow volume forecasts.
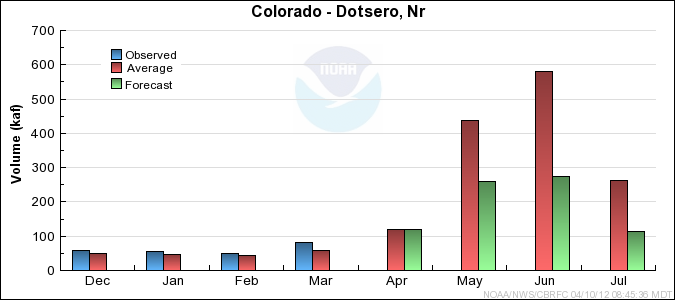
Forecast Summary:
A wet October was followed by much below average precipitation in November and Decemeber. Near average
precipitation occurred in January and February. As of March 1st the Upper Colorado had its best
conditions of the season with both the seasonal precipitation and basin snow water equivalent near 80 percent of average.
However, March 2012 was one of the warmest and driest March's in the last 30 years in the Upper Colorado basin
and as of April 1st the snow water equivalent was just 50 percent of average with seasonal precipitation
near 70 percent of average. Because of the unusual conditions during March there were
very large drops in the April through July forecast runoff volumes from what was issued March 1st.
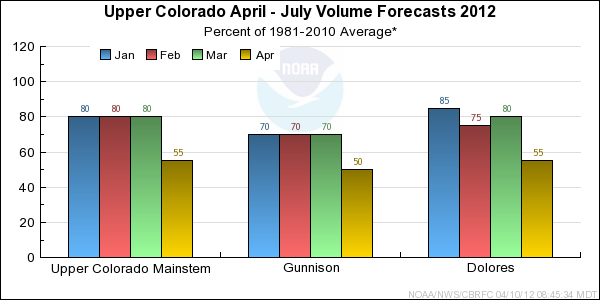
Current April through July streamflow volume
forecasts
range between 46 and 68 percent of average with a median value of 55 percent.
* Percent usable capacity, not percent average contents.
Click for multi-month Graph.
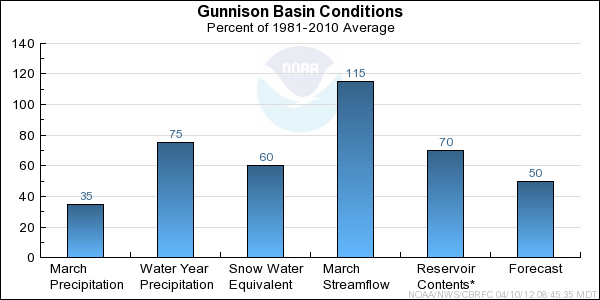
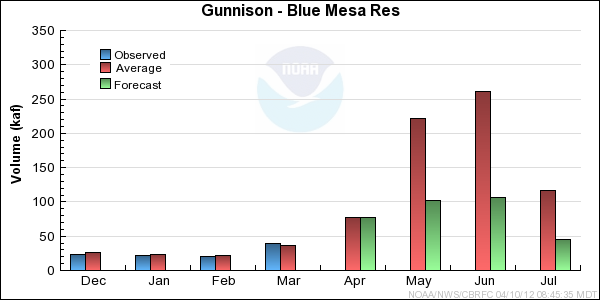
Gunnison Basin Conditions
The following conditions influenced this month's forecasts:
Precipitation:
Seasonal October through March
precipitation ranged from 70 to 95 percent of
average in the Gunnison Basin.
March
precipitation was much below average over the entire Gunnison Basin. For
individiual sites March precipitation ranged from 15 to 55 percent of average, with a Basin
average of 35 percent.
Snow:
April 1st snow water equivalent was 60 percent of average in the Gunnison Basin, but varied with several
locations below 50 percent of average and some below 40 percent of average. An early onset of the snow melt
occurred at all elevation levels due to much above average temperatures in March.
Gunnison Basin
snow
water equivalent plot
Streamflow:
March streamflow volumes were above average due to the early snow melt. Runoff volumes in March ranged from
near average to near 145 percent of average.
Soil Moisture:
Modeled
soil
moisture states were above average entering the winter season.
Climate Forecasts:
La Nina climate conditions existed throughout the winter but these do not show a strong
correlation with winter precipitation or Apri-July runoff volumes in the Gunnison Basin.
Therefore they were not influential in the development of streamflow volume forecasts.
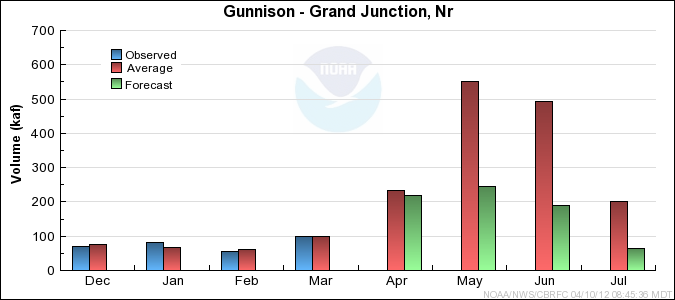
Forecast Summary:
A wet October was followed by drier condtions in November and December and very dry conditions in March.
Precipitation was near or above average at most locations in January and February. Seasonal precipitation
was near 75 percent of average as of March 1st. Snow melt occurred at all elevations due to dry and
warm conditions in March. By April 1st the Gunnison Basin snow water equivalent was reduced to 60 percent
of average with several sites reporting less than 50 percent of average. Streamflow forecasts were
reduced significantly from those issued March 1st. April-July
streamflow runoff volumes are expected to range between 45 and 70 percent of the 1981-2010 average.
* Percent usable capacity, not percent average contents.
Click for multi-month Graph.
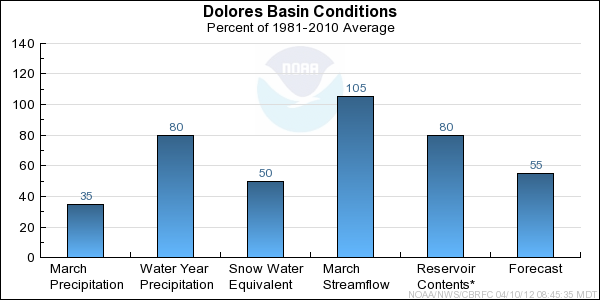
Dolores Basin Conditions
The following conditions influenced this month's forecasts:
Precipitation:
Seasonal October through March
precipitation ranged between 75 and
100 percent of average in the Dolores Basin.
March
precipitation was much below average. For individual sites
March precipitation ranged from 25 to 50 percent of average, with a Basin average of 35 percent.
Snow:
April 1st snow water equivalent was near 50 percent of average in the Dolores Basin, with a few
locations near or below 40 percent of average. An early onset of the snow melt
occurred at all elevation levels due to much above average temperatures in March.
Dolores Basin
snow
water equivalent plot
Streamflow:
March streamflow volumes in the Dolores River Basin were near 105 percent of average.
Soil Moisture:
Modeled
soil
moisture states were near average entering the winter season.
Climate Forecasts:
La Nina climate conditions existed throughout the winter but these do not show a strong correlation
with winter precipitation or April-July runoff volumes in the Dolores Basin. Therefore,
it was not influential in the development of streamflow volume forecasts.
Forecast Summary:
Near average soil moisture existed in the Dolores River Basin entering the winter
season. Seasonal precipitation was below average for most areas as of April 1st.
Snow melt occurred at all elevations due to dry and warm conditions in March. By April 1st
the Dolores Basin snow water equivalent was reduced to 50 percent of average with several
sites reporting near 40 percent of average. Streamflow forecasts were reduced significantly
from those issued March 1st. April-July
streamflow
runoff volumes are expected to range from 45 to 65 percent of the 1981-2010 average.
* Percent usable capacity, not percent average contents.
Click for multi-month Graph.
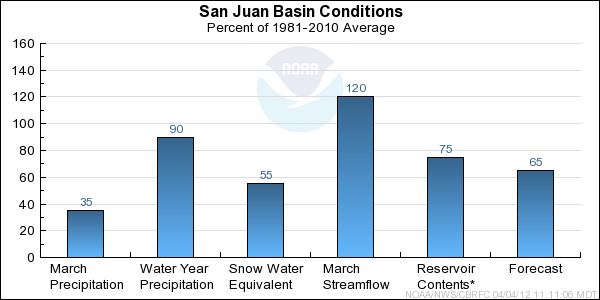
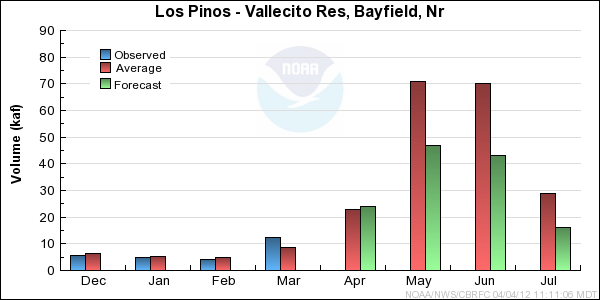
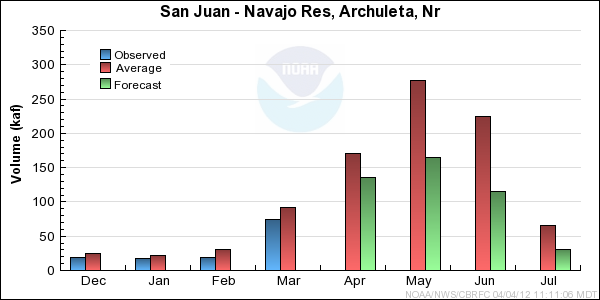
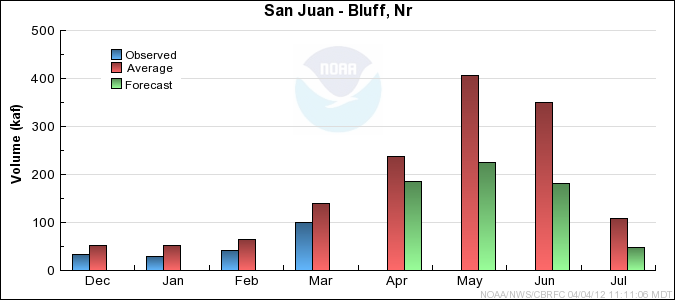
San Juan Basin Conditions
The following conditions influenced this month's forecasts:
Precipitation:
Seasonal October through March
precipitation was 90 percent of average in the San Juan Basin.
March
precipitation was 35 percent of average in the San Juan Basin. At individual locations
the March precpitation ranged from near 15 to 55 percent of average.
Snow:
April 1st snow water equivalent for the entire basin was near 55 percent of average, and ranged from 30 to 70 percent
of average at individual sites. An early onset of the snow melt occurred at all elevation levels due to much above
average temperatures in March.
Animas River Basin
Snow Plot.
San Juan Basin (above Navajo Reservoir)
Snow Plot.
Streamflow:
Streamflow volumes were above average for March due to the early snow melt. Runoff volumes ranged from near 110 to 140 percent
of average at most locations with 165 percent of average on the Florida River.
Soil Moisture:
Modeled
soil moisture was near to above
average at highest elevations entering the winter season. Below average soil moisture conditions existed
over the southern half of the basin and in tributaries further downstream.
Climate Forecasts:
La Nina climate conditions existed through the winter months. The La Nina climate condition suggests drier
than average conditions possible over the San Juan Basin. The La Nina climate condition was considered when
developing the forecasts.
Forecast Summary:
Seasonal precipitation, October through March, was near 90 percent of average. Snow melt occurred at all elevations
due to dry and warm conditions in March. By April 1st the San Juan Basin snow water equivalent was reduced to 55 percent
of average with some sites reporting less than 30 percent of average. Soil moisture varied
entering the winter season, with near or slightly above average conditions in high elevations in the northern headwaters,
and below average conditions elsewhere. La Nina climate conditions suggest below average precipitation possible over
the San Juan Basin through spring.
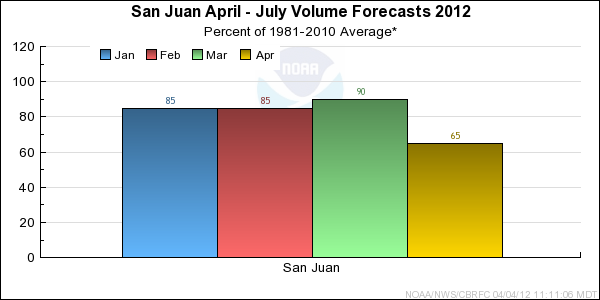
Streamflow forecasts were reduced significantly from those issued March 1st.
April-July
runoff volumes are expected to range from 55 to 75 percent of the 1981-2010 average.
* Percent usable capacity, not percent average contents.
Click for multi-month Graph.
Differences between the full period forecasts and the residual forecasts may not exactly equal the actual observed volumes due to rounding conventions (see Definitions section).
Reservoir Monthly Inflow Forecasts
Monthly Streamflows
Precipitation Maps