
NOAA, National Weather Service
Colorado Basin River Forecast Center
Salt Lake City, Utah
www.cbrfc.noaa.gov
| Prepared by Alcorn NOAA, National Weather Service Colorado Basin River Forecast Center Salt Lake City, Utah www.cbrfc.noaa.gov |

| Forecast Period | 90% Exceedance Volume | 50% Exceedance Volume | Percent Average | 10% Exceedance Volume | |
| Green | |||||
| Daniel, Nr, Warren Bridge, At | April-July | 210 | 250 | 94 | 295 |
| May-July | 185 | 225 | 92 | 270 | |
| Pine Ck | |||||
| Fremont Lk, Abv | April-July | 85 | 100 | 96 | 116 |
| May-July | 82 | 97 | 95 | 113 | |
| New Fork | |||||
| Big Piney, Nr | April-July | 290 | 370 | 94 | 460 |
| May-July | 270 | 350 | 95 | 440 | |
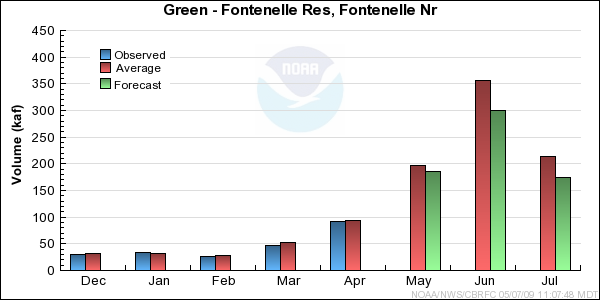
| Green | |||||
| Fontenelle Res, Fontenelle Nr | April-July | 570 | 750 | 87 | 960 |
| May-July | 480 | 660 | 86 | 870 | |
| Big Sandy | |||||
| Farson, Nr | April-July | 34 | 45 | 78 | 58 |
| May-July | 31 | 42 | 79 | 55 | |
| Green | |||||
| Green River, Wy, Nr | April-July | 575 | 765 | 87 | 985 |
| May-July | 480 | 670 | 86 | 890 | |
| Hams Fork | |||||
| Frontier, Nr, Pole Ck, Blo | April-July | 44 | 58 | 89 | 74 |
| May-July | 38 | 52 | 88 | 68 | |
| Viva Naughton Res | April-July | 57 | 80 | 90 | 107 |
| May-July | 49 | 72 | 95 | 99 | |
| Blacks Fork | |||||
| Robertson, Nr | April-July | 64 | 85 | 89 | 109 |
| May-July | 61 | 82 | 89 | 106 | |
| Ef Smiths Fork | |||||
| Robertson, Nr | April-July | 17.2 | 25 | 86 | 34 |
| May-July | 16.2 | 24 | 86 | 33 | |
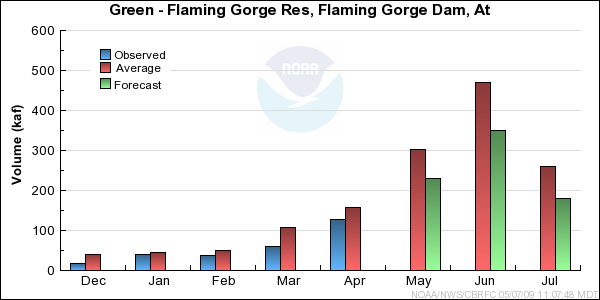
| Green | |||||
| Flaming Gorge Res, Flaming Gorge Dam, At | April-July | 590 | 890 | 75 | 1260 |
| May-July | 460 | 760 | 74 | 1130 |
| Forecast Period | 90% Exceedance Volume | 50% Exceedance Volume | Percent Average | 10% Exceedance Volume | |
| Yampa | |||||
| Stagecoach Rsvr, Abv | April-July | 19.7 | 29 | 100 | 42 |
| May-July | 12.7 | 22 | 100 | 35 | |
| Steamboat Springs | April-July | 225 | 275 | 98 | 330 |
| May-July | 185 | 235 | 98 | 290 | |
| Elk | |||||
| Milner, Nr | April-July | 290 | 350 | 108 | 420 |
| May-July | 245 | 305 | 109 | 375 | |
| Elkhead Ck | |||||
| Elkhead, Nr | April-July | 29 | 41 | 105 | 55 |
| May-July | 23 | 35 | 106 | 49 | |
| Maynard Gulch, Blo | April-July | 44 | 62 | 105 | 84 |
| May-July | 34 | 52 | 108 | 74 | |
| Fortification Ck | |||||
| Fortification, Nr | March-June | 4.9 | 8 | 107 | 12.2 |
| May-June | 2.5 | 4 | 100 | 6 | |
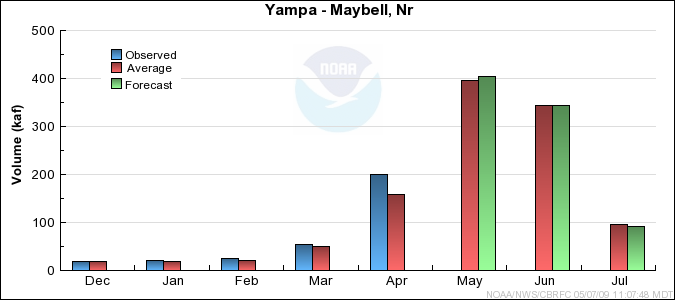
| Yampa | |||||
| Maybell, Nr | April-July | 850 | 1040 | 105 | 1260 |
| May-July | 650 | 840 | 101 | 1060 | |
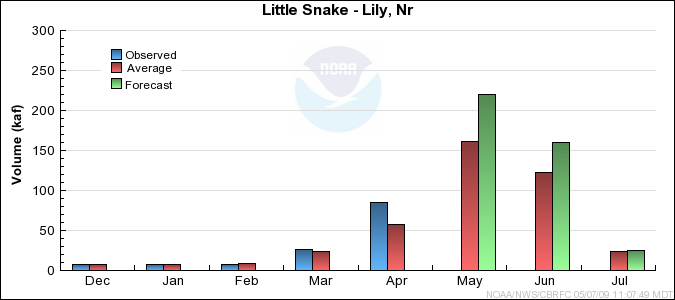
| Little Snake | |||||
| Slater, Nr | April-July | 167 | 205 | 129 | 250 |
| May-July | 142 | 180 | 127 | 225 | |
| Dixon, Nr | April-July | 330 | 440 | 133 | 565 |
| May-July | 265 | 375 | 132 | 500 | |
| Lily, Nr | April-July | 370 | 490 | 134 | 630 |
| May-July | 285 | 405 | 131 | 545 | |
| White | |||||
| Meeker, Nr | April-July | 220 | 290 | 100 | 370 |
| May-July | 186 | 255 | 98 | 355 | |
| Watson, Nr | April-July | 210 | 315 | 103 | 420 |
| May-July | 175 | 280 | 104 | 385 |
| Forecast Period | 90% Exceedance Volume | 50% Exceedance Volume | Percent Average | 10% Exceedance Volume | |
| Big Brush Ck | |||||
| Vernal, Nr, Red Fleet Res, Abv | April-July | 11.1 | 16 | 76 | 22 |
| May-July | 9.8 | 14.7 | 79 | 21 | |
| Ashley Ck | |||||
| Vernal, Nr | April-July | 32 | 42 | 81 | 53 |
| May-July | 30 | 40 | 82 | 51 | |
| Wf Duchesne | |||||
| Hanna, Nr | April-July | 13.9 | 21 | 88 | 30 |
| May-July | 11.6 | 18.7 | 85 | 28 | |
| Duchesne | |||||
| Tabiona, Nr | April-July | 64 | 87 | 83 | 114 |
| May-July | 55 | 78 | 82 | 105 | |
| Rock Ck | |||||
| Upper Stillwater Res | April-July | 57 | 69 | 84 | 82 |
| May-July | 53 | 65 | 82 | 78 | |
| Mountain Home, Nr | April-July | 64 | 78 | 88 | 94 |
| May-July | 60 | 74 | 87 | 90 | |
| Currant Ck | |||||
| Currant Ck Res | April-July | 16.2 | 23 | 92 | 32 |
| May-July | 7.5 | 14.3 | 65 | 23 | |
| Strawberry | |||||
| Soldier Springs, Nr | April-July | 39 | 55 | 93 | 75 |
| May-July | 24 | 40 | 85 | 60 | |
| Duchesne, Nr | April-July | 71 | 105 | 86 | 148 |
| May-July | 49 | 83 | 77 | 126 | |
| Duchesne | |||||
| Duchesne, Nr, Knight Div, Abv | April-July | 122 | 158 | 84 | 200 |
| May-July | 105 | 141 | 82 | 183 | |
| Lake Fork | |||||
| Moon Lake Res, Mtn Home, Nr | April-July | 44 | 55 | 81 | 68 |
| May-July | 42 | 53 | 82 | 66 | |
| Yellowstone | |||||
| Altonah, Nr | April-July | 44 | 55 | 89 | 68 |
| May-July | 41 | 52 | 88 | 65 | |
| Whiterocks | |||||
| Whiterocks, Nr | April-July | 35 | 48 | 86 | 63 |
| May-July | 33 | 46 | 87 | 61 | |
| Duchesne | |||||
| Myton | April-July | 139 | 200 | 75 | 275 |
| May-July | 104 | 165 | 69 | 240 | |
| Randlett, Nr | April-July | 135 | 240 | 74 | 385 |
| May-July | 100 | 205 | 69 | 350 |
| Forecast Period | 90% Exceedance Volume | 50% Exceedance Volume | Percent Average | 10% Exceedance Volume | |
| White | |||||
| Blo Tabbyune Ck, Soldier Summit, Nr | April-July | 13 | 17 | 98 | 22 |
| May-July | 9.2 | 13.2 | 97 | 17.9 | |
| Gooseberry Ck | |||||
| Scofield, Nr | April-July | 8.7 | 11.5 | 97 | 14.7 |
| May-July | 7.6 | 10.4 | 96 | 13.6 | |
| Price | |||||
| Scofield Res, Scofield, Nr | April-July | 36 | 45 | 98 | 56 |
| May-July | 30 | 39 | 98 | 50 | |
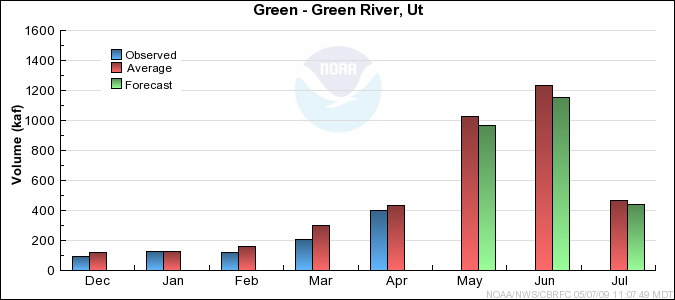
| Green | |||||
| Green River, Ut | April-July | 2510 | 2960 | 93 | 3410 |
| May-July | 2110 | 2560 | 93 | 3010 | |
| Huntington Ck | |||||
| Electric Lake | April-July | 11.1 | 15 | 96 | 19.5 |
| May-July | 9.4 | 13.3 | 95 | 17.8 | |
| Huntington, Nr | April-July | 30 | 40 | 82 | 51 |
| May-July | 26 | 36 | 80 | 47 | |
| Seeley Ck | |||||
| Joes Vly Res, Orangeville, Nr | April-July | 32 | 47 | 81 | 65 |
| May-July | 29 | 44 | 81 | 62 | |
| Ferron Ck | |||||
| Ferron, Nr | April-July | 21 | 27 | 69 | 34 |
| May-July | 18.7 | 25 | 69 | 32 | |
| Muddy Ck | |||||
| Emery, Nr | April-July | 10.7 | 16 | 80 | 22 |
| May-July | 9.8 | 15.1 | 84 | 21 |
| Forecast Period | 90% Exceedance Volume | 50% Exceedance Volume | Percent Average | 10% Exceedance Volume | |
| Colorado | |||||
| Lake Granby, Granby, Nr | April-July | 192 | 230 | 102 | 270 |
| May-July | 175 | 215 | 100 | 255 | |
| Willow Ck | |||||
| Willow Ck Res, Granby, Nr | April-July | 42 | 52 | 102 | 64 |
| May-July | 34 | 44 | 94 | 56 | |
| Fraser | |||||
| Winter Park | April-July | 17.9 | 21 | 105 | 25 |
| May-July | 17 | 20 | 104 | 24 | |
| Williams Fork | |||||
| Williams Fork Res, Parshall, Nr | April-July | 87 | 103 | 108 | 121 |
| May-July | 78 | 94 | 106 | 112 | |
| Muddy Ck | |||||
| Wolford Mtn Res, Blo | April-July | 47 | 58 | 97 | 72 |
| May-July | 38 | 49 | 94 | 63 | |
| Blue | |||||
| Dillon Res | April-July | 153 | 180 | 108 | 210 |
| May-July | 143 | 170 | 108 | 200 | |
| Green Mtn Res | April-July | 260 | 310 | 111 | 365 |
| May-July | 240 | 290 | 109 | 345 | |
| Colorado | |||||
| Kremmling, Nr | April-July | 790 | 945 | 109 | 1090 |
| May-July | 700 | 855 | 106 | 1000 | |
| Eagle | |||||
| Gypsum, Blo | April-July | 300 | 370 | 110 | 450 |
| May-July | 270 | 340 | 108 | 420 | |
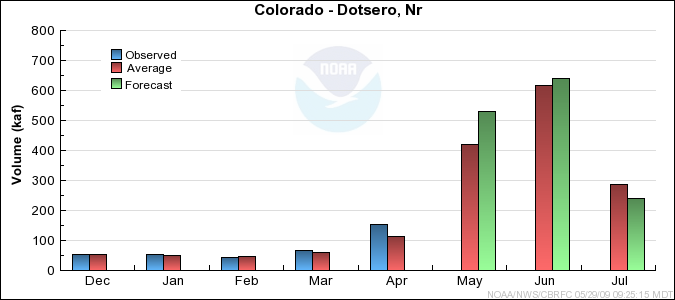
| Colorado | |||||
| Dotsero, Nr | April-July | 1310 | 1570 | 109 | 1860 |
| May-July | 1150 | 1410 | 106 | 1700 | |
| Frying Pan | |||||
| Ruedi Res, Basalt, Nr | April-July | 114 | 145 | 103 | 182 |
| May-July | 104 | 135 | 101 | 172 | |
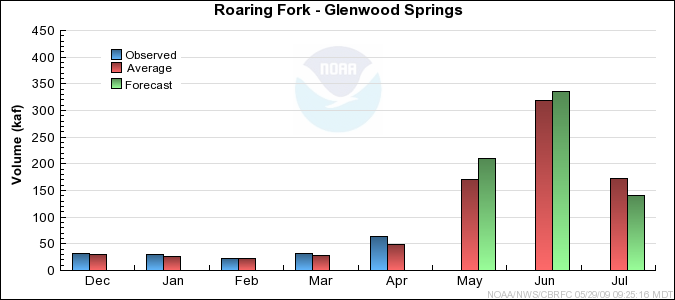
| Roaring Fork | |||||
| Glenwood Springs | April-July | 630 | 750 | 106 | 890 |
| May-July | 565 | 685 | 103 | 825 | |
| Colorado | |||||
| Glenwood Springs, Blo | April-July | 1950 | 2300 | 106 | 2700 |
| May-July | 1750 | 2100 | 105 | 2500 | |
| Cameo, Nr | April-July | 2200 | 2600 | 107 | 3050 |
| May-July | 1950 | 2350 | 106 | 2800 | |
| Plateau Ck | |||||
| Cameo, Nr | April-July | 67 | 92 | 80 | 132 |
| May-July | 45 | 70 | 72 | 110 | |
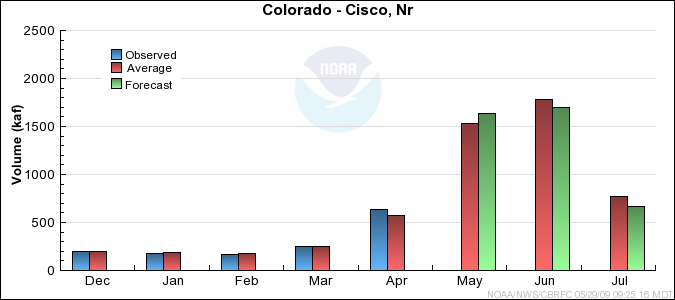
| Colorado | |||||
| Cisco, Nr | April-July | 3940 | 4650 | 100 | 5740 |
| May-July | 3300 | 4010 | 98 | 5100 | |
| Mill Ck | |||||
| Moab, Nr, Sheley Tun, At | April-July | 1.9 | 2.8 | 56 | 4.1 |
| May-July | 1.4 | 2.3 | 53 | 3.6 | |
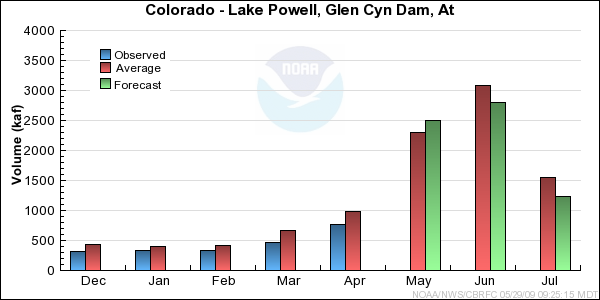
| Colorado | |||||
| Lake Powell, Glen Cyn Dam, At | April-July | 6170 | 7300 | 92 | 8770 |
| May-July | 5400 | 6530 | 94 | 8000 |
| Forecast Period | 90% Exceedance Volume | 50% Exceedance Volume | Percent Average | 10% Exceedance Volume | |
| Taylor | |||||
| Taylor Park Res | April-July | 80 | 100 | 97 | 122 |
| May-July | 69 | 89 | 94 | 111 | |
| Almont | April-July | 134 | 165 | 100 | 189 |
| May-July | 115 | 146 | 97 | 170 | |
| East | |||||
| Almont | April-July | 171 | 200 | 104 | 235 |
| May-July | 147 | 176 | 99 | 210 | |
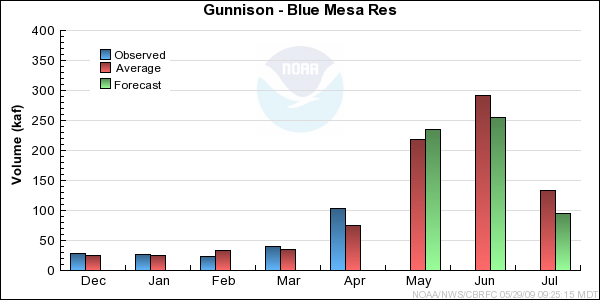
| Gunnison | |||||
| Gunnison, Nr | April-July | 320 | 400 | 103 | 490 |
| May-July | 270 | 350 | 99 | 440 | |
| Tomichi Ck | |||||
| Gunnison | April-July | 40 | 60 | 74 | 89 |
| May-July | 27 | 47 | 69 | 76 | |
| Lake Fork | |||||
| Gateview | April-July | 88 | 105 | 83 | 124 |
| May-July | 77 | 94 | 79 | 113 | |
| Gunnison | |||||
| Blue Mesa Res | April-July | 555 | 690 | 96 | 845 |
| May-July | 450 | 585 | 91 | 740 | |
| Morrow Point Res | April-July | 620 | 755 | 96 | 935 |
| May-July | 500 | 635 | 91 | 815 | |
| Crystal Res | April-July | 710 | 845 | 92 | 1070 |
| May-July | 580 | 715 | 88 | 940 | |
| Muddy Ck | |||||
| Paonia Res, Bardine, Nr | March-June | 77 | 100 | 100 | 130 |
| April-July | 76 | 102 | 100 | 136 | |
| May-June | 44 | 67 | 89 | 97 | |
| May-July | 49 | 75 | 91 | 109 | |
| Nf Gunnison | |||||
| Somerset, Nr | April-July | 265 | 320 | 105 | 385 |
| May-July | 199 | 255 | 98 | 320 | |
| Surface Ck | |||||
| Cedaredge | April-July | 11.5 | 15 | 88 | 19.4 |
| May-July | 8.7 | 12.2 | 82 | 16.2 | |
| Uncompahgre | |||||
| Ridgway Res | April-July | 71 | 90 | 88 | 113 |
| May-July | 58 | 77 | 84 | 100 | |
| Colona | April-July | 90 | 120 | 86 | 158 |
| May-July | 72 | 102 | 83 | 140 | |
| Delta | April-July | 77 | 100 | 85 | 133 |
| May-July | 57 | 80 | 81 | 113 | |
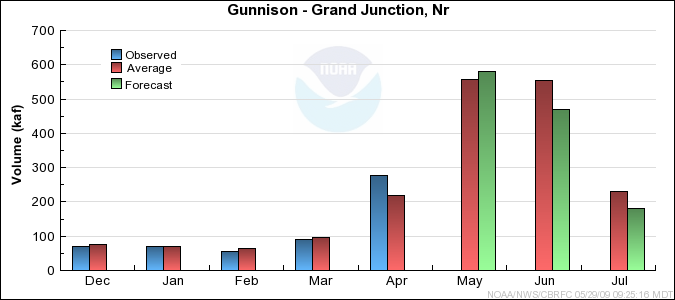
| Gunnison | |||||
| Grand Junction, Nr | April-July | 1240 | 1500 | 96 | 1790 |
| May-July | 970 | 1230 | 92 | 1520 |
| Forecast Period | 90% Exceedance Volume | 50% Exceedance Volume | Percent Average | 10% Exceedance Volume | |
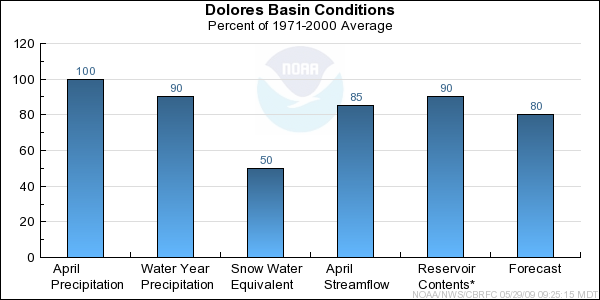
| Dolores | |||||
| Dolores | April-July | 168 | 220 | 83 | 285 |
| May-July | 123 | 175 | 80 | 240 | |
| Mcphee Res | April-July | 200 | 260 | 81 | 335 |
| May-July | 141 | 200 | 77 | 275 | |
| San Miguel | |||||
| Placerville, Nr | April-July | 91 | 115 | 87 | 143 |
| May-July | 75 | 99 | 85 | 127 | |
| Dolores | |||||
| Cisco, Nr | April-July | 385 | 500 | 81 | 605 |
| May-July | 290 | 405 | 86 | 510 |
| Forecast Period | 90% Exceedance Volume | 50% Exceedance Volume | Percent Average | 10% Exceedance Volume | |
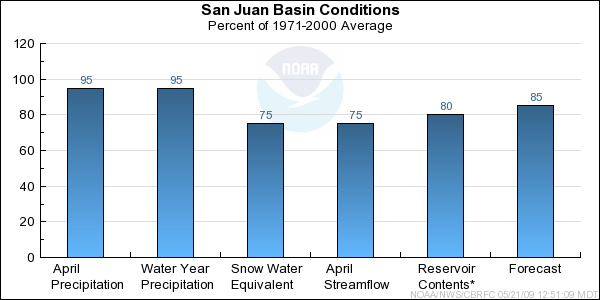
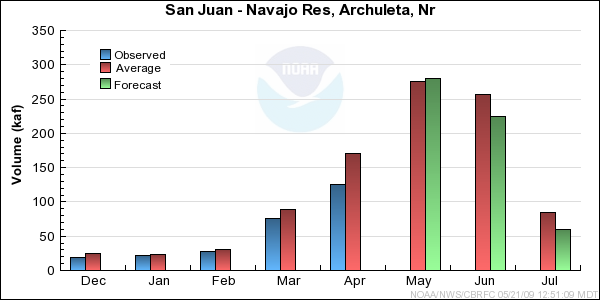
| San Juan | |||||
| Pagosa Springs | April-July | 171 | 200 | 89 | 250 |
| May-July | 135 | 164 | 85 | 215 | |
| Carracas, Nr | April-July | 295 | 355 | 88 | 425 |
| May-July | 230 | 290 | 89 | 360 | |
| Navajo Res, Archuleta, Nr | April-July | 565 | 690 | 88 | 825 |
| May-July | 440 | 565 | 92 | 700 | |
| Farmington | April-July | 795 | 1030 | 85 | 1220 |
| May-July | 625 | 860 | 87 | 1050 | |
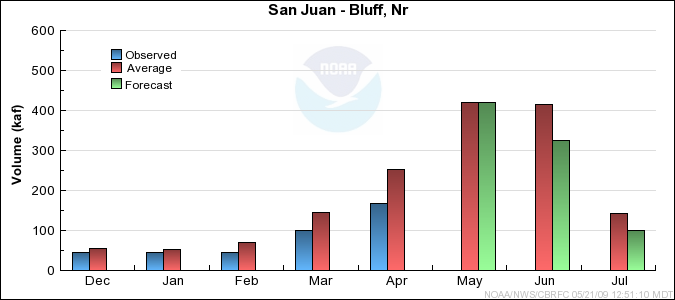
| Bluff, Nr | April-July | 765 | 1010 | 82 | 1290 |
| May-July | 600 | 845 | 87 | 1120 | |
| Rio Blanco | |||||
| Pagosa Springs, Nr, Blanco Dam, Blo | April-July | 40 | 50 | 94 | 62 |
| May-July | 31 | 41 | 91 | 53 | |
| Navajo | |||||
| Chromo, Nr, Oso Div Dam, Blo | April-July | 50 | 62 | 90 | 77 |
| May-July | 39 | 51 | 88 | 66 | |
| Piedra | |||||
| Arboles, Nr | April-July | 152 | 190 | 83 | 235 |
| May-July | 113 | 151 | 88 | 196 | |
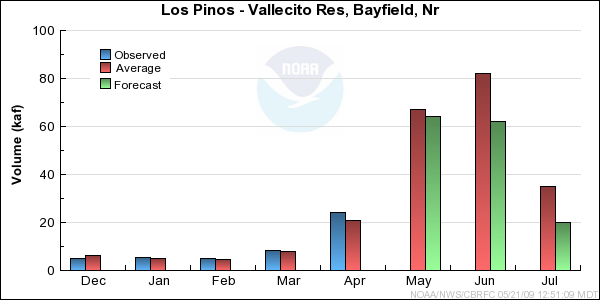
| Los Pinos | |||||
| Vallecito Res, Bayfield, Nr | April-July | 142 | 170 | 83 | 200 |
| May-July | 118 | 146 | 79 | 178 | |
| Animas | |||||
| Durango | April-July | 295 | 370 | 84 | 460 |
| May-July | 245 | 320 | 82 | 410 | |
| Florida | |||||
| Lemon Res, Durango, Nr | April-July | 36 | 45 | 78 | 55 |
| May-July | 31 | 40 | 75 | 50 | |
| La Plata | |||||
| Hesperus | April-July | 15.1 | 19 | 76 | 24 |
| May-July | 11.9 | 15.8 | 75 | 21 | |
| Mancos | |||||
| Mancos, Nr | April-July | 10.7 | 25 | 76 | 39 |
| May-July | 6.8 | 21 | 72 | 35 | |
| South Ck | |||||
| Lloyds Rsvr Nr Monticello, Abv | March-July | 0.11 | 0.36 | 26 | 0.85 |
| Usable Capacity | EOM Contents | Percent Usable Capacity | Last Year EOM | Last Year %Capacity | ||
| Lake Granby, Granby, Nr
| | 490.3 | 234.4 | 48 | 217.6 | 44 |
| Willow Ck Res, Granby, Nr
| | 9.1 | 8.2 | 90 | 8.2 | 90 |
| Williams Fork Res, Parshall, Nr
| | 96.9 | 82.2 | 85 | 81.1 | 84 |
|
| ||||||
| 66.0 | 57.5 | 87 | 53.8 | 82 | ||
| Dillon Res
| | 254.0 | 225.8 | 89 | 222.2 | 87 |
| Green Mtn Res | 146.9 | 72.3 | 49 | 65.4 | 44 | |
| Homestake Res
| | 43.0 | 7.6 | 18 | 24.6 | 57 |
| Ruedi Res, Basalt, Nr
| | 102.0 | 68.8 | 67 | 55.8 | 55 |
| Vega Res, Collbran, Nr
| | 32.9 | 19.8 | 60 | 18.0 | 55 |
| Taylor Park Res
| | 106.2 | 77.0 | 72 | 63.1 | 59 |
| Blue Mesa Res
| | 829.5 | 580.1 | 70 | 410.8 | 50 |
| Morrow Point Res | 117.0 | 113.6 | 97 | 108.9 | 93 | |
| Crystal Res | 17.5 | 16.9 | 96 | 16.5 | 94 | |
| Paonia Res, Bardine, Nr
| | 18.5 | 1.5 | 8 | 1.3 | 7 |
| Ridgway Res
| | 83.2 | 72.5 | 87 | 52.8 | 64 |
| Mcphee Res
| | 381.1 | 330.0 | 87 | 344.6 | 90 |
|
| ||||||
| TOTAL | 2794.1 | 1968.0 | 70 | 1744.7 | 62 | |
| Colorado | ||||||
| Lake Powell | 24322.0 | 12857.5 | 53 | 11194.8 | 46 | |
|
| ||||||
| TOTAL | 24322.0 | 12857.5 | 53 | 11194.8 | 46 |
| Usable Capacity | EOM Contents | Percent Usable Capacity | Last Year EOM | Last Year %Capacity | ||
| Vallecito Res, Bayfield, Nr
| | 125.4 | 93.5 | 75 | 42.8 | 34 |
| Navajo Res, Archuleta, Nr
| | 1701.3 | 1332.1 | 78 | 1360.2 | 80 |
| Lemon Res, Durango, Nr
| | 39.8 | 24.0 | 60 | 21.4 | 54 |
|
| ||||||
| TOTAL | 1866.5 | 1449.6 | 78 | 1424.3 | 76 |
| Range | Round to | |
| 0-1.99 | 0.01 | |
| 2.0-19.9 | 0.1 | |
| 20-199 | 1.0 | |
| 200-999 | 5.0 | |
| 1000+ | 3 significant digits |