New 1981-2010 Averages being used this year.
Note: This publication is currently undergoing major revisions. The current publication will be replaced with a new publication based on stakeholder requirements and scientific advances. We expect to begin sharing details on this soon. If you have input on content, format, or publication frequency at any time, please contact us at cbrfc.webmasters@noaa.gov.Lake Powell Water Supply Outlook, May 1, 2012Lake Powell Water Supply Outlook, May 1, 2012
Contents
Lake Powell Sub-Basin Summaries
*Median of forecasts within each basin.
*Median of forecasts within each basin.
*Median of forecasts within each basin.
Upper Green Basin Conditions
The following conditions influenced this month's forecasts:
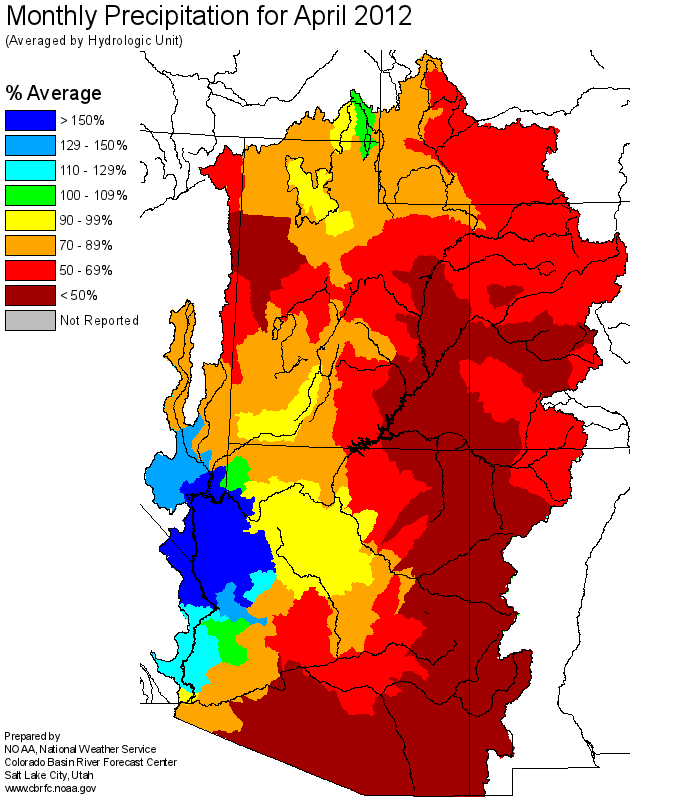
Precipitation:
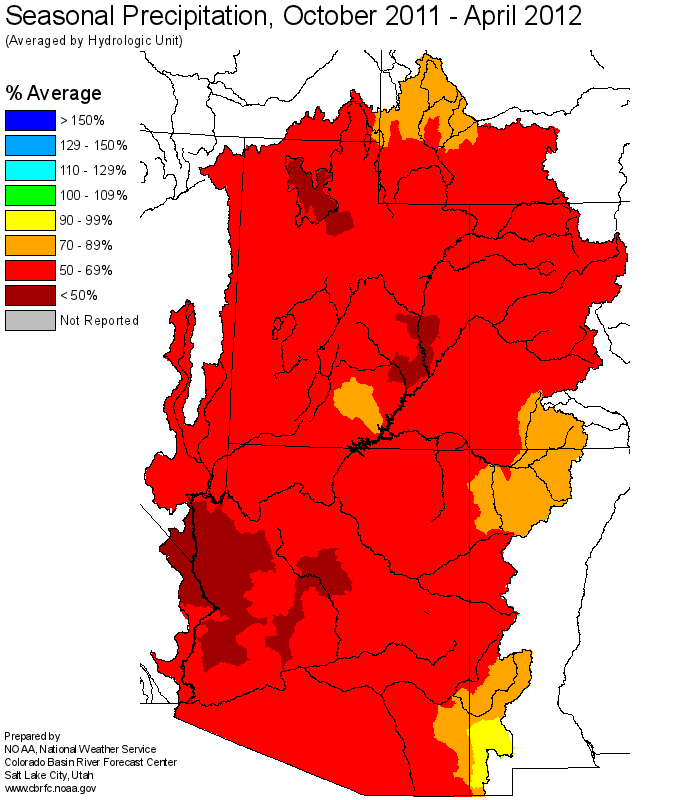
Seasonal October through April
precipitation was 90 percent of average
in the Upper Green basin as a whole. April
precipitation was 65 percent of average.
Snow:
May 1st snow water equivalent was 50 percent of average in the basin as a whole as measured at
the snotel locations. It is important to note that the highest snotel location is at 9800 feet
in the Upper Green; however, the basin extends to elevations up to 13,000 feet. Nearly half of
the basin is not represented by the snotel network. Low and mid elevation snowmelt has continued with another month of above average
temperatures and below average precipitation. Remote sensing data suggests that a
considerable amount of snow remains at high elevations.
--- Upper Green basin
snow
water equivalent plot.
Streamflow:
April streamflow was near 110 percent of average.
Soil Moisture:
Modeled
soil
moisture states indicated near average to above average soil moisture conditions
last fall prior to snow accumulation.
Climate Forecasts:
Climate forecasts were not a factor because there is not a strong correlation
between La Nina conditions and winter precipitation in the Upper Green basin.
Forecast Summary:
Similar to March, April had much below average precipitation and above average temperatures. However, seasonal precipitation in the Upper
Green remains near average as a result of above average precipitation in months other than December, March and April.
The addition of another unseasonably warm and dry month in conjunction with continued snowmelt has resulted in significant
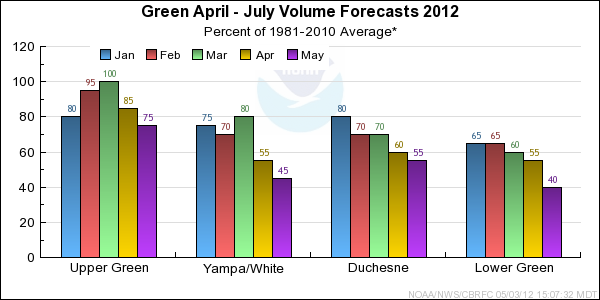
decreases in the April through July forecasts. Current April through July streamflow volume forecasts in the headwaters of the Upper Green have
decreased by 10 to 20 percent while forecasts for basins located in the Wyoming range (Ham's Fork) and the North Slope of the
Uintas decreased by 15 to 25 percent. April through July forecasts now range between 48 and 90 percent of average with a median value of 74 percent.

* Percent usable capacity, not percent average contents.
Click for multi-month Graph.
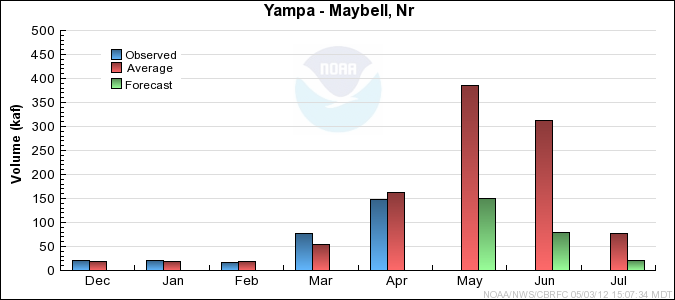
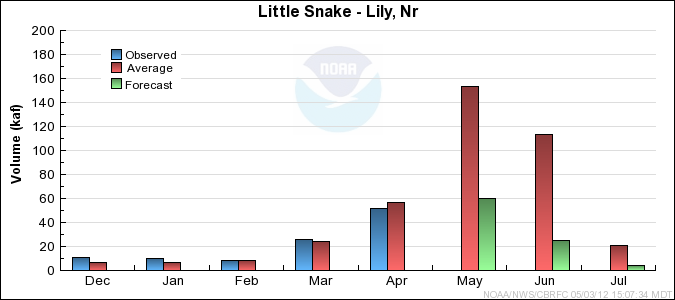
Yampa/White Basin Conditions
The following conditions influenced this month's forecasts:
Precipitation:
Seasonal October through April
precipitation was 65 percent of average
in the Yampa/White basin. April
precipitation was near 50 percent of average.
Snow:
April 1st snow water equivalent was 30 percent of average in the basin. Significant snowmelt
has continued with another month of above average temperatures and below average precipitation. Many of the snotel
locations have record low snow or have completely melted out. The majority of remaining snow is located above 10,000 feet.
--- Yampa basin
snow
water equivalent plot.
Streamflow:
April streamflow was 105 percent of average over the basin as a whole. However, some headwater locations
had monthly volumes between 140 and 160 percent of average.
Soil Moisture:
Modeled
soil
moisture states indicated above average to much above average soil moisture conditions
last fall prior to snow accumulation.
Climate Forecasts:
Climate forecasts were not a factor in the forecasts because there is not a strong correlation
between La Nina conditions and winter precipitation in the Yampa/White basin.
Forecast Summary:
Above average temperatures and much below average precipitation continue to prevail in the
Yampa/White. As a result, snow and water supply conditions have continued to deteriorate
rapidly. Unseasonably warm and dry conditions in April, have resulted in another significant
decrease in the April through July streamflow volume forecasts. Forecasts have decreased by and
additional 15 to 20 percent. Forecasts have decreased by as much as 50 percent from March 1 due
to the conditions in March and April and many of the May through July forecasts are in the bottom five
of the historical records. April through July forecasts now range between 32 and 55 percent of average
with a median value of 45 percent.
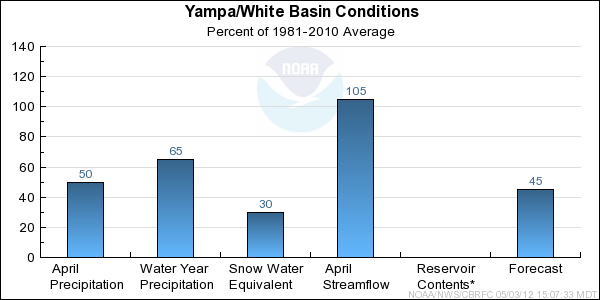
* Percent usable capacity, not percent average contents.
Click for multi-month Graph.
Duchesne Basin Conditions
The following conditions influenced this month's forecasts:
Precipitation:
Seasonal October through April
precipitation was 80 percent of average
in the Duchesne basin. April
precipitation was 60 percent of average.
Snow:
May 1st snow water equivalent was 30 percent of average in the basin. Significant snowmelt
has continued with another month of above average temperatures and below average precipitation. Many of the snotel
locations have record or near record low snow or have completely melted out.
The majority of remaining snow is located above 10,000 feet.
--- Duchesne basin
snow
water equivalent plot.
Streamflow:
April streamflow was near 185 percent of average over the basin as a whole. However, some headwater locations
had monthly volumes greater than 200 percent.
Soil Moisture:
Modeled
soil
moisture states indicated much above average soil moisture conditions
last fall prior to snow accumulation.
Climate Forecasts:
Climate forecasts were not a factor in the forecasts because there is not a strong correlation
between La Nina conditions and winter precipitation in the Duchesne basin.
Forecast Summary:
Similar to March, April had much below average precipitation and above average temperatures.
The addition of another unseasonably warm and dry month in conjunction with continued snowmelt has
resulted in another decrease in the April through July forecasts. Current April through July
streamflow volume forecasts decreased by 10 to 20 percent. May through July forecasts for many of the low
elevations basins such as Strawberry near Solider Springs and Currant Creek are in the bottom
five of the historical records. April through July forecasts now range between 20 and 68 percent of average with
a median value of 55 percent
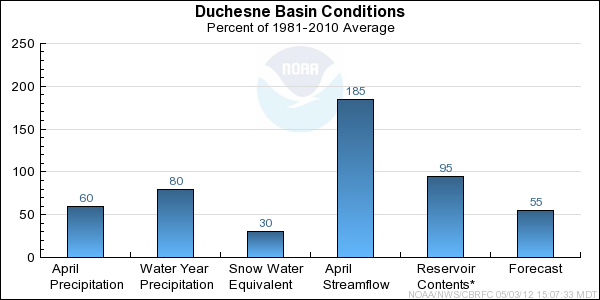
* Percent usable capacity, not percent average contents.
Click for multi-month Graph.
Lower Green Basin Conditions
The following conditions influenced this month's forecasts:
Precipitation:
Seasonal October through April
precipitation was 75 percent of average
in the Lower Green basin. April
precipitation was 55 percent of average.
Snow:
There is no snow remaining at any of the snotel sites. Any remaining snow is located at
the highest elevations.
--- Lower Green basin
snow
water equivalent plot.
Streamflow:
April streamflow was near 105 percent of average over the basin as a whole.
Soil Moisture:
Modeled
soil
moisture states indicated near average to above average soil moisture conditions
last fall prior to snow accumulation.
Climate Forecasts:
Climate forecasts were not a factor in the forecasts because there is not a strong correlation
between La Nina conditions and winter precipitation in the Lower Green basin.
Forecast Summary:
Similar to March, April had much below average precipitation and above average temperatures.
The addition of another unseasonably warm and dry month in conjunction with continued snowmelt has
resulted in another decrease in the April through July forecasts.
As a result, current April through July streamflow volume forecasts have decreased by 15 to 30 percent
and now range between 16 and 48 percent of average with a median value of 39 percent.
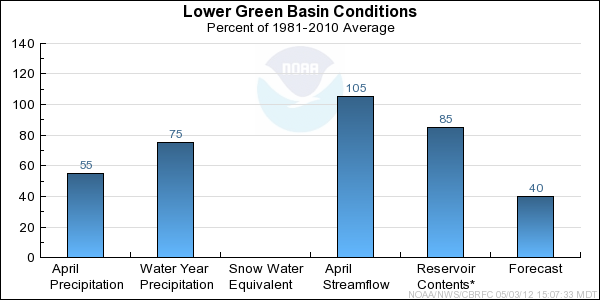
* Percent usable capacity, not percent average contents.
Click for multi-month Graph.
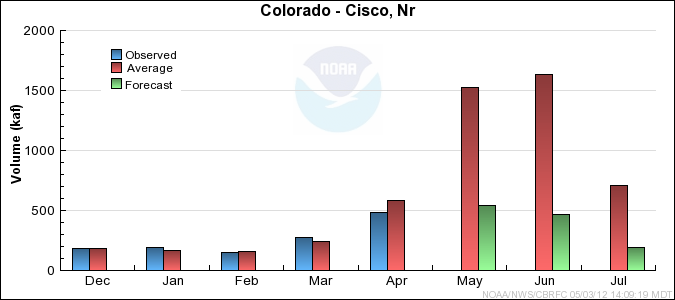
Upper Colorado Mainstem Basin Conditions
The following conditions influenced this month's forecasts:
Precipitation:
Seasonal October through April
precipitation
was near 65 percent of average in the Upper Colorado mainstem basin.
April was another much below average
precipitation
month with 50 percent of average.
Snow:
May 1st snow water equivalent was near just 20 percent of average in the basin as a whole.
In a normal year snow continues to accumulate through March and into the middle of April
at higher elevations, but this year snow melt began by the last half of March.
Most SNOTEL sites below 10,500 feet in the basin do not have any
snow left, and many of those melted out at the earliest time in their 30 year history.
--- Upper Colorado basin
snow
water equivalent plot
Streamflow:
April streamflow was near to above average in the basin as a whole. However,
some sites in the upper part of the basin had volumes greater than 150% of average.
Soil Moisture:
Modeled
soil
moisture states were above average heading into the winter.
Climate Forecasts:
La Nina climate conditions existed throughout the winter but these do not show a strong correlation with winter
precipitation in the Upper Colorado mainstem basin, and therefore were not influential in the development
of streamflow volume forecasts.
Forecast Summary:
A wet October was followed by much below average precipitation in November and December. Near average
precipitation occurred in January and February. March 2012 was one of the warmest and driest March's
in the last 30 years in the Upper Colorado basin and April was another warm, dry month, although not to
the same extent as March. As of May 1st the snow water equivalent was just 20 percent of average with
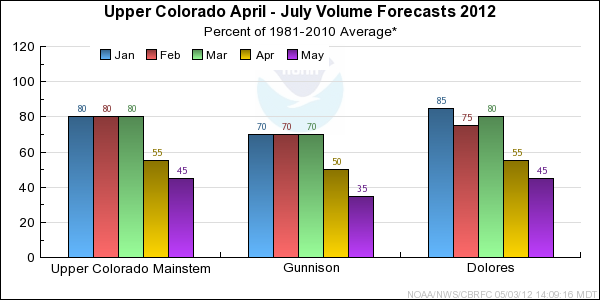
seasonal precipitation near 65 percent of average. There were again large drops in the
forecast runoff volumes from what was issued last month. Most of the May through July forecasts
are for volumes that would be the 2nd or 3rd lowest on record if they occurred.
Current May through July streamflow volume
forecasts
range between 25 and 50 percent of average with a median value of 40 percent.
Current April through July streamflow volume
forecasts
range between 35 and 55 percent of average with a median value of 45 percent.
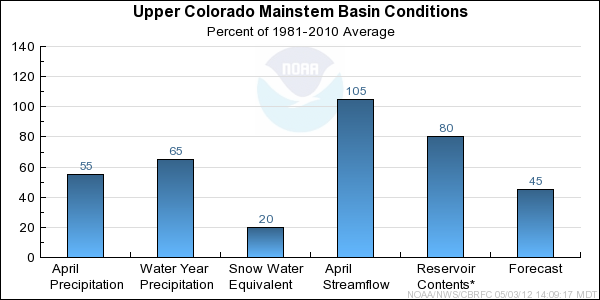
* Percent usable capacity, not percent average contents.
Click for multi-month Graph.
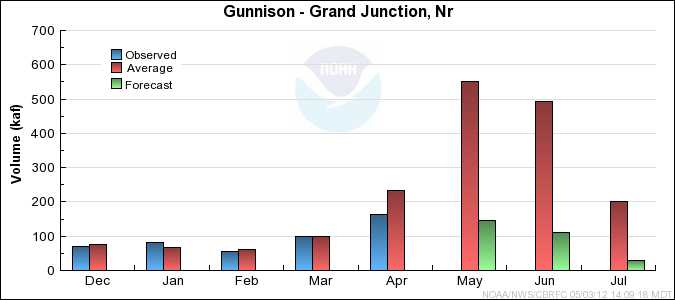
Gunnison Basin Conditions
The following conditions influenced this month's forecasts:
Precipitation:
Seasonal October through April
precipitation ranged from 60 to 85 percent of
average in most of the Gunnison River Basin.
April was another warm and dry month in the Gunnison Basin with
precipitation
generally between 30 to 65 percent of average.
Snow:
The May 1st snow water equivalent for the Gunnison Basin was near 30 percent of average. However snow has
melted out at several measuring sites. Where snow remains it ranged between 10 and 55 percent of average
on May 1st.
All areas have experienced a very early snow melt as above average
temperatures occurred in March and April. Some snow measuring sites that were void of snow in
April or early May melted out a full 4 to 6 weeks earlier than average.
Gunnison Basin
snow
water equivalent plot
Streamflow:
Streamflow volumes for April were near or above average, ranging from 100 to 145 percent of average
at higher elevation and headwater locations. At locations further downstream April streamflow ranged from
60 to 85 percent of average, most likely due to lack of snow that was depleted prior to April, and increased
irrigation demands due to the warm and dry conditions.
Soil Moisture:
Modeled
soil
moisture states were above average entering the winter season.
Climate Forecasts:
La Nina climate conditions existed throughout the winter but these do not show a strong
correlation with winter precipitation or Apri-July runoff volumes in the Gunnison Basin.
Therefore they were not influential in the development of streamflow volume forecasts.
Forecast Summary:
Although October was wet and soil moisture was above average entering the season,
the very dry and warm spring, lack of snow, and early snow melt have had a detrimental impact
on the anticpated April-July streamflow runoff volumes. Forecast runoff volumes have been further
reduced from those issued in April. Several forecasts are now the 2nd or 3rd lowest on record.
Seasonal April-July
streamflow runoff volumes
are expected to range from near 15 to 50 percent of average. May-July
streamflow runoff
volumes are expected to range from near 10 to 45 percent of average.
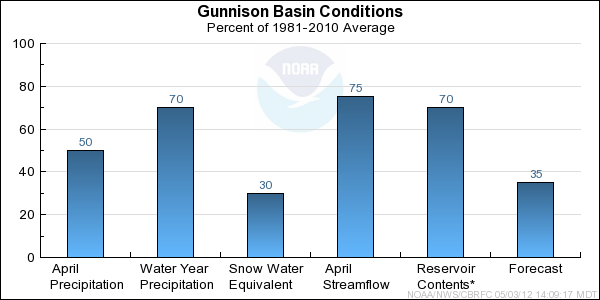
* Percent usable capacity, not percent average contents.
Click for multi-month Graph.
Dolores Basin Conditions
The following conditions influenced this month's forecasts:
Precipitation:
Seasonal October through April
precipitation ranged between 70 and
95 percent of average in the Dolores Basin.
April experienced above average temperatures and much below average
precipitation.
For individual sites April precipitation ranged from 20 to 80 percent of average, with a Basin
average of 60 percent.
Snow:
The May 1st snow water equivalent for the Dolores Basin was near 20 percent of average. However most
snow measring sites had already melted out with remaining snow confined to the highest elevations and
north facing or protected locations. Some snow measuring sites have melted out a full 4 to 8 weeks earlier
than average.
Dolores Basin
snow
water equivalent plot
Streamflow:
Streamflow volumes for April were near or above average at high elevation headwater locations, ranging from
105 to 150 percent of average. At locations further downstream April streamflow ranged from
55 to 90 percent of average, most likely due to lack of snow that was depleted prior to April, and increased
irrigation demands due to the warm and dry conditions.
Soil Moisture:
Modeled
soil
moisture states were near average entering the winter season.
Climate Forecasts:
La Nina climate conditions existed throughout the winter but these do not show a strong correlation
with winter precipitation or April-July runoff volumes in the Dolores Basin. Therefore,
it was not influential in the development of streamflow volume forecasts.
Forecast Summary:
Although October was wet and soil moisture was near or slightly above average entering the season,
the lack of snow during the winter combined with warmer and drier conditions during the spring
has had a detrimental impact on anticipated April-July streamflow runoff volumes. Forecast
runoff volumes have been further reduced from those issued in April. Some forecasts are now among
the bottom 5 on record. Forecast April-July
streamflow
runoff volumes are expected to range from 45 to 50 percent of the 1981-2000 average. May-July
streamflow runoff volumesrunoff volumes are expected to range between 30 and 40
percent of average.
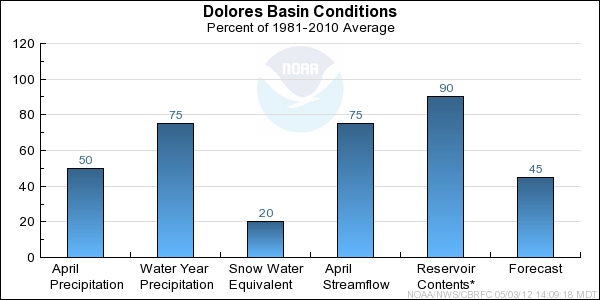
* Percent usable capacity, not percent average contents.
Click for multi-month Graph.
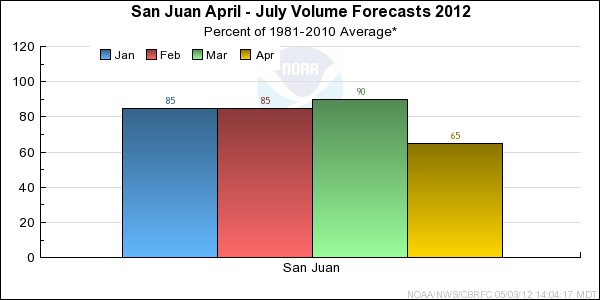
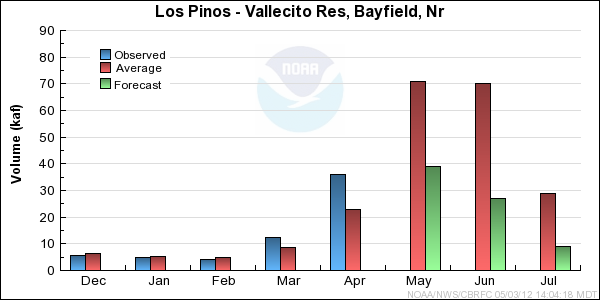
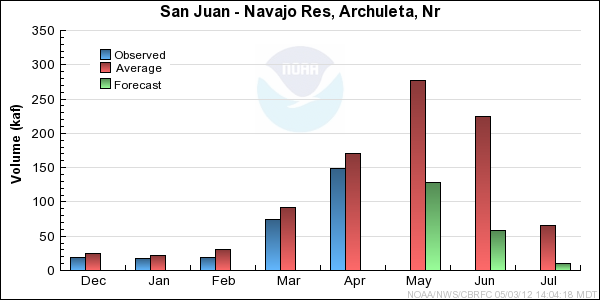
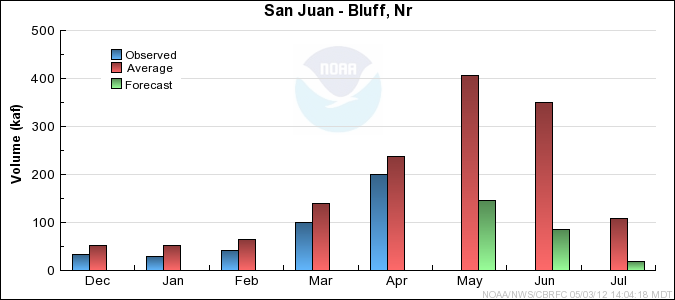
San Juan Basin Conditions
The following conditions influenced this month's forecasts:
Precipitation:
Seasonal October through April
precipitation was 85 percent of average in the San Juan Basin.
April was similar to March with much below average
precipitation. At individual
sites precipitation ranged mostly between 30 to 75 percent of average. Basin wide April preciptation was 55 percent
of average.
Snow:
May 1st snow water equivalent was 25 percent of average for the San Juan Basin. However, at many measuring sites snow
has melted out and where it remains values ranged from less than 5 to near 45 percent of average on May 1st.
Due to dry conditions and above averages temperatuers in March and April, the snow melted off more than a month
earlier than average at several locations.
Animas River Basin
Snow Plot.
San Juan Basin (above Navajo Reservoir)
Snow Plot.
Streamflow:
Streamflow volumes were generally above average in April due to the early snow melt. Streamflow volumes in April ranged
from 85 to over 200 percent of average.
Soil Moisture:
Modeled
soil moisture was near to above
average at highest elevations entering the winter season. Below average soil moisture conditions existed
over the southern half of the basin and in tributaries further downstream.
Climate Forecasts:
La Nina climate conditions existed through the winter months. The La Nina climate condition suggests drier
than average conditions possible over the San Juan Basin. The La Nina climate condition was considered when
developing the forecasts.
Forecast Summary:
Despite a wet October and near or above average soil moisture conditions in some headwater areas, the dry and warm
spring, low snowpack, and early snow melt had a detrimental impact on anticpated April-July streamflow runoff volumes.
Forecast volumes have been further reduced from those issued April 1st. Forecast April-July
runoff volumes range from 35 to 65 percent
of the 1981-2010 average. May-July
runoff volumes volumes are expected to range
from near 20 to 50 percent of average.
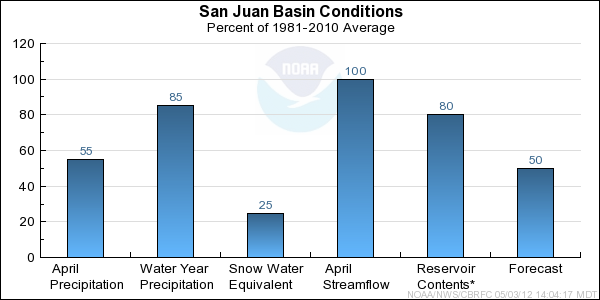
* Percent usable capacity, not percent average contents.
Click for multi-month Graph.
Differences between the full period forecasts and the residual forecasts may not exactly equal the actual observed volumes due to rounding conventions (see Definitions section).
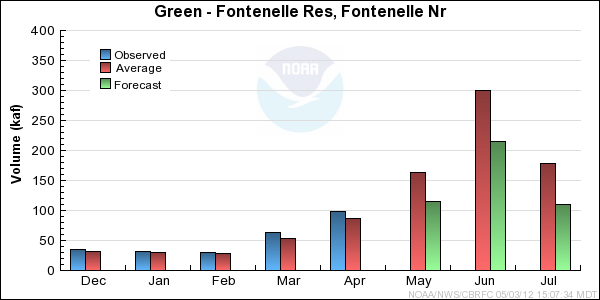
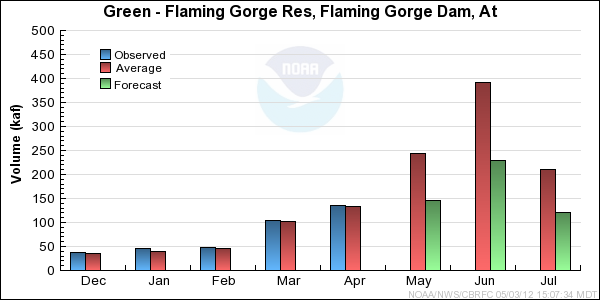
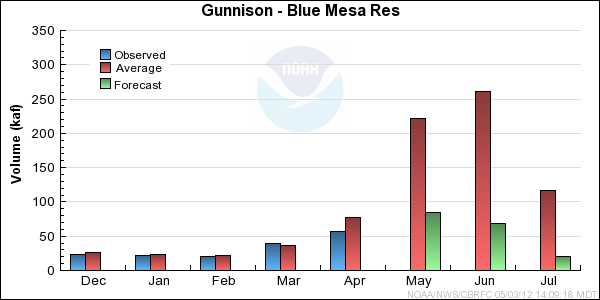
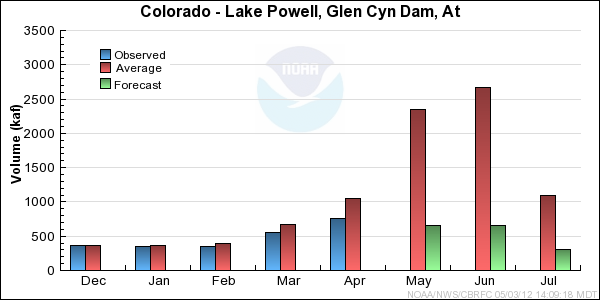
Reservoir Monthly Inflow Forecasts
Monthly Streamflows
Precipitation Maps