Note: This publication is currently undergoing major revisions. The current publication will be replaced with a new publication based on stakeholder requirements and scientific advances. We expect to begin sharing details on this soon. If you have input on content, format, or publication frequency at any time, please contact us at cbrfc.webmasters@noaa.gov.Lake Powell Water Supply Outlook, June 1, 2009Lake Powell Water Supply Outlook, June 1, 2009
Contents
Lake Powell Sub-Basin Summaries
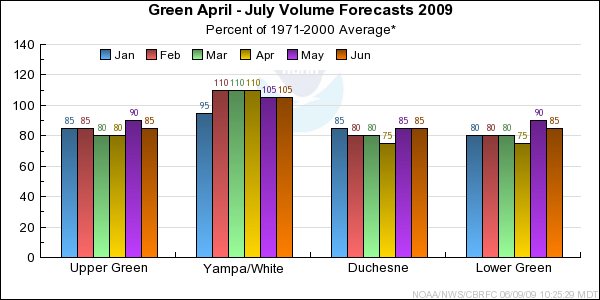
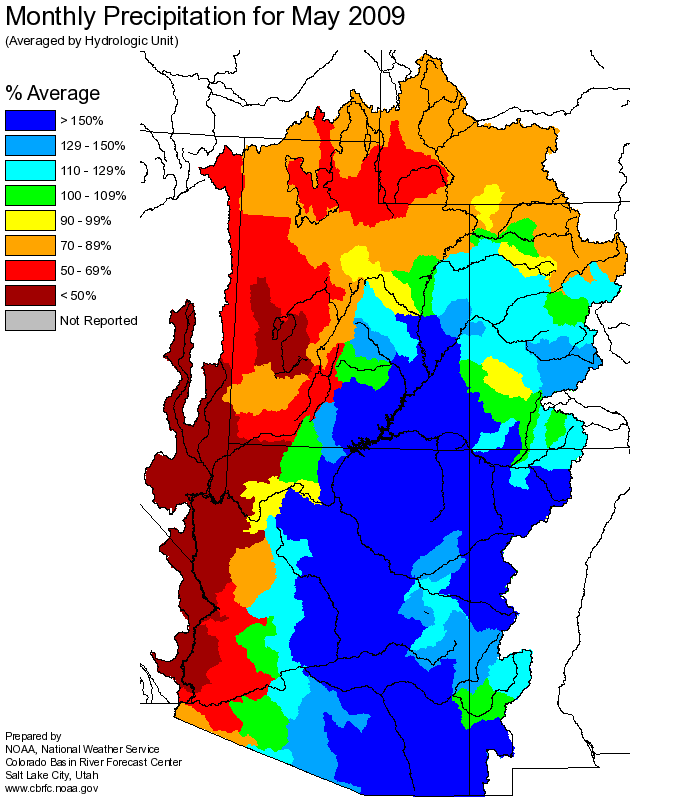
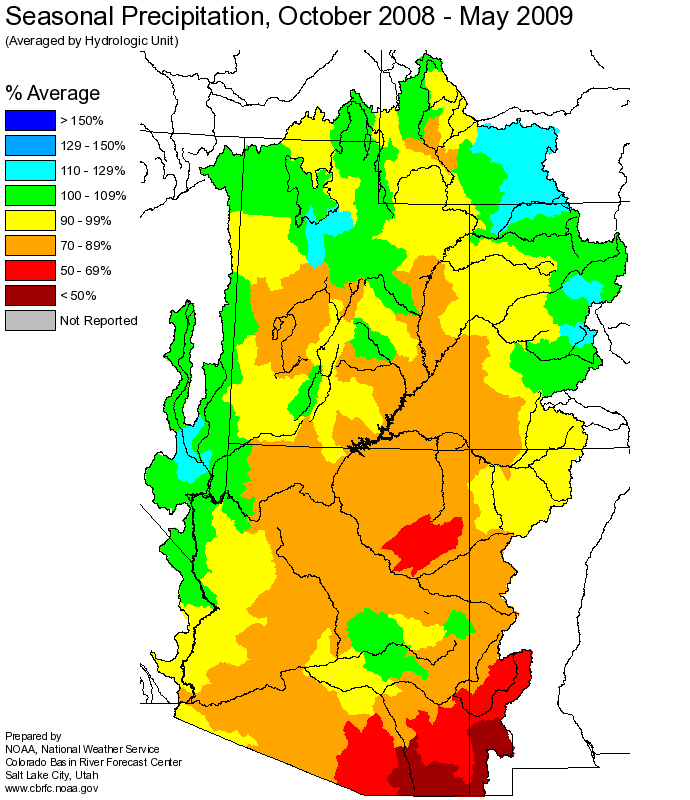
At the time of this publication, seasonal precipitation is near normal for most of the region. May precipitation was below average
in the Upper Green and Duchense river basins, and was near average in the Yampa/White and Lower Green river basins. Snowpack is past the seasonal peaks. Median June water
supply forecasts stayed the same in the Yampa/White and Duchense river basins, and dropped slighty in the Upper and Lower Green river basins.
*Median of forecasts within each basin.
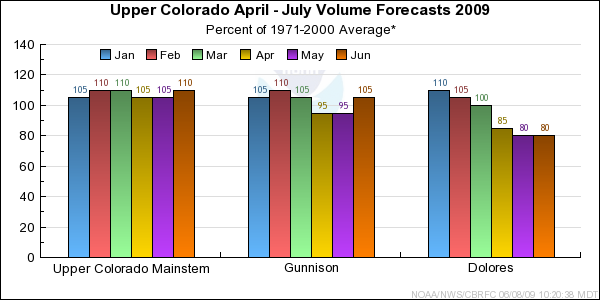
A week long period of widespread convection near the end of May provided the majority of the precipitation for the month and caused large variations in the percent average precipitation across the Upper Colorado, Gunnison, and Dolores basins. The Gunnison River headwaters were a favored location for some of the heaviest showers and ended the month with 120% of average precipitation. Southern areas of the Upper Colorado Basin and the upper Dolores River saw near to above average precipitation. On the other hand, the San Miguel River and the north and extreme eastern portions of the Upper Colorado Basin headwaters had below average precipitation with 85% and 80% of average, respectively. The majority of the snow was already melted in all basins by June 1, with most remaining snow above 11,000 feet. Overall, the June 1st April through July forecast runoff volumes increased from the May 1st forecasts in the Upper Colorado and Gunnison basins and showed little change in the Dolores Basin.
*Median of forecasts within each basin.
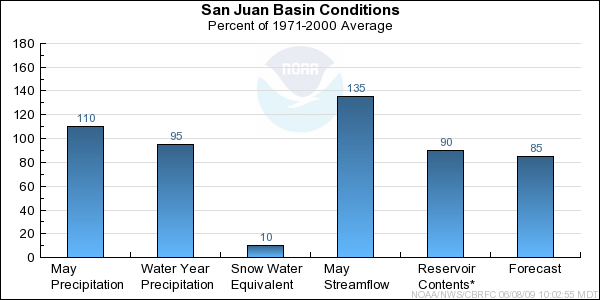
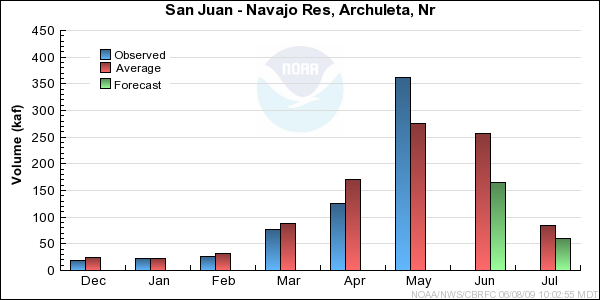
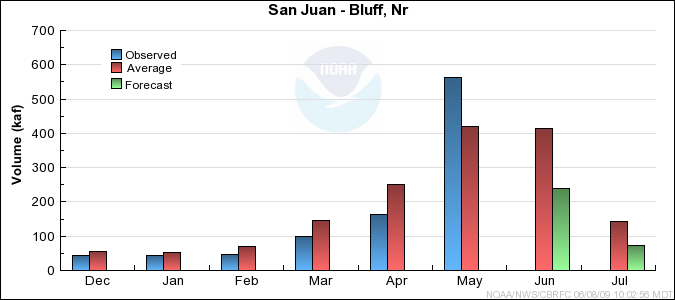
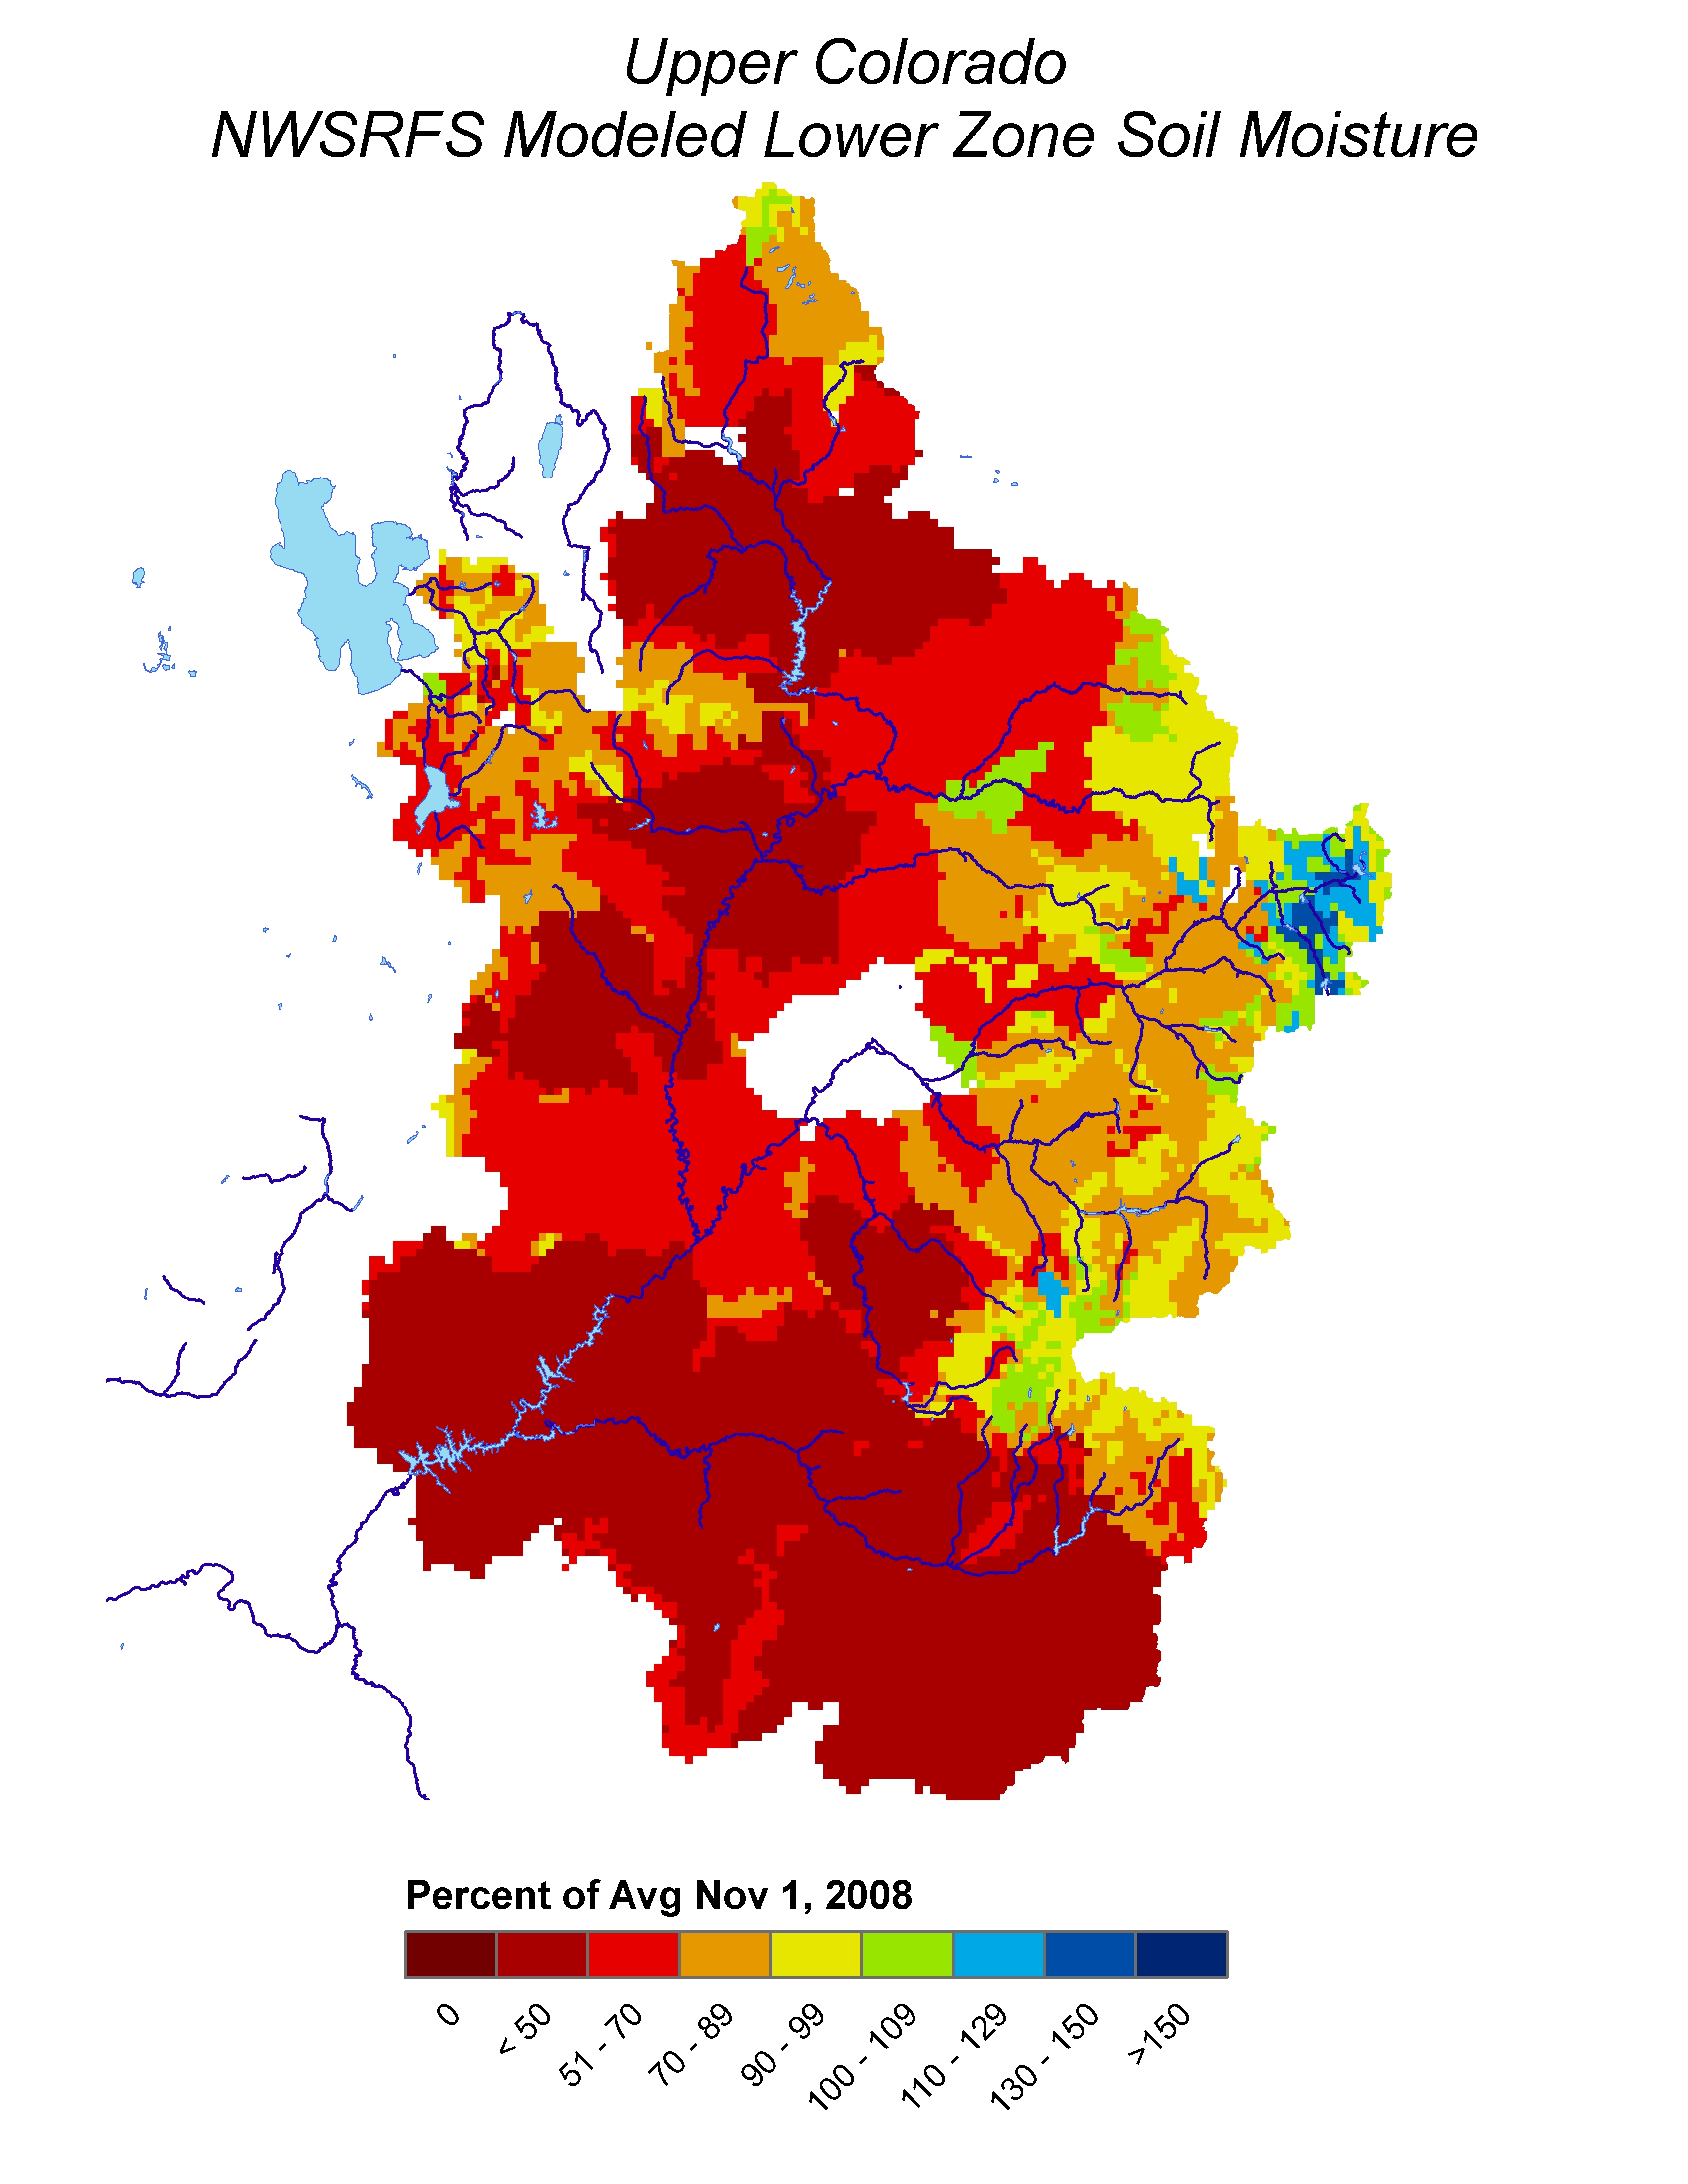
-Model Soil Moisture/Observed Streamflow...
Soil moisture
for most of the upper basins in the San Juan were below average last fall. This was most likely due
to limited monsoonal precipitation over the summer months. Observed streamflow for the month of May
was much above average for most portions of the San Juan Basin due to much above average temperatures during the first 7
to 14 days of May.
-Snowpack/Precipitation...
Snow water equivalent
for the entire San Juan Basin on June 1st was 10 percent of average with the remaining snow well above 11,000 feet.
The upper San Juan Basin recieved near to above average precipitation during May, while the lower portions recieved much above normal
amounts. This was due to an approximate week long convective outbreak that had similarities to the monsoon. This wet period in May,
combined with the extremely wet December, has kept seasonal precipitation to 95 percent of average for the entire Basin.
-Short Term Precipitation Forecast... As of June 8th, meteorological models were predicting increased
chances for below normal temperatures and above normal precipitation through the middle of June.
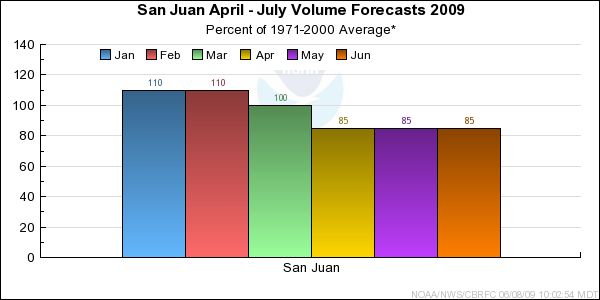
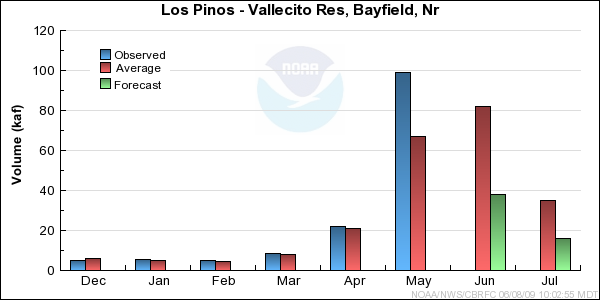
-General Discussion...Due to the below average soil moisture in the upper basin this fall and the
combination of current snowpack conditions and May observed flow, the median April-July forecast
for the San Juan Basin is 85 percent of average. The median of the June-July forecasts is 55 percent of average since most of the snow
pack has melted off.
*Median of forecasts within each basin.
Upper Green Basin Conditions
-
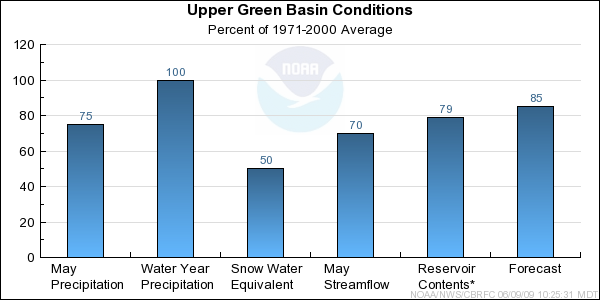
Model Soil Moisture/Observed Streamflow...The November soil
moisture conditions were much below average in the Upper Green River basin. This was most likely due to prolonged dry conditions within the basin over the last nine years. Observed streamflow for the month of May was 70 percent of average.
-Snowpack/Precipitation...On June 1st, the basinwide
snowpack
was 50 percent of average. However, the upper part of the basin, above 10,000 feet in elevation, is not gaged. Therefore, the actual basinwide snowpack may be greater than
reported. In the Upper Green River basin, May precipitation was 75 percent of average. However, because previous months have received above average
precipitation, the seasonal precipitation is average at this time.
-Short Term Precipitation Forecast...As of June 8th, meteorological models were predicting increased chances for below normal temperatures and above normal precipitation through
the middle of June.
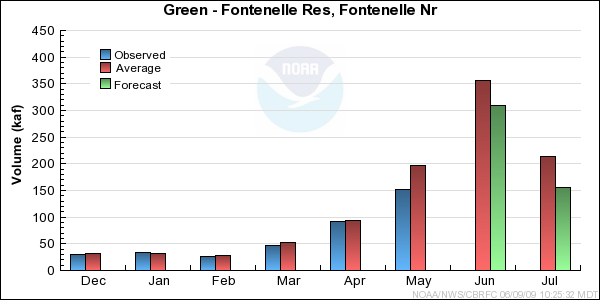
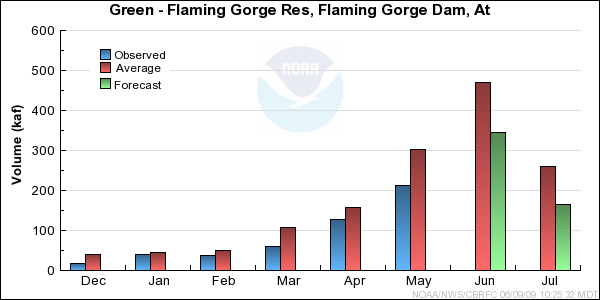
-General Discussion...Most of the April through July volume forecasts stayed the same or decreased slightly from the May 1st issuance and indicate below average to near average runoff volumes for points above Flaming Gorge.
The June-July volume forecasts for Fontenelle Reservoir and Flaming Gorge Reservoir inflows are essentially the same percentage-wise as the April-July volume forecasts.
* Percent usable capacity, not percent average contents.
Click for multi-month Graph.
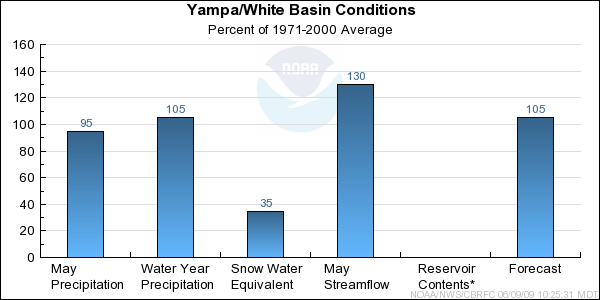
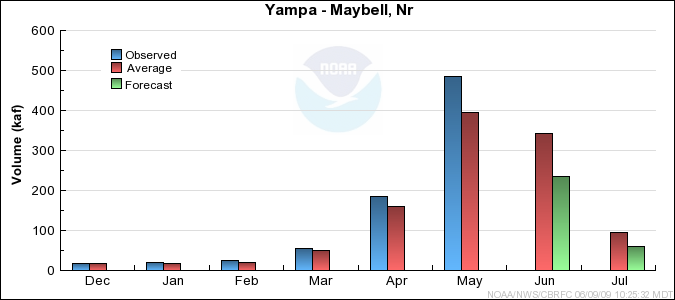
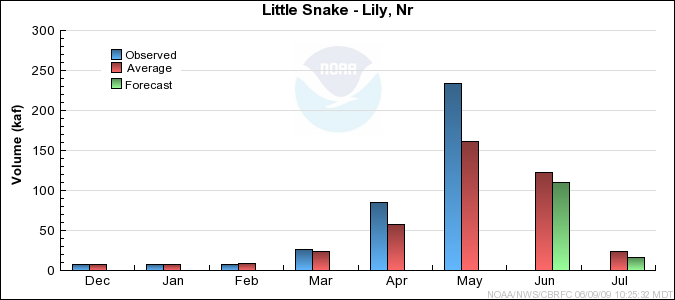
Yampa/White Basin Conditions
-
Model Soil Moisture/Observed Streamflow...Fall soil moisture
estimates were near average in the headwaters of the Yampa and White River basin. Soil moisture deficits are not adversely effecting model guidance as much as in other regions.
While the overall monthly average maximum temperatures during May in the Yampa and White River basin were near normal, the monthly average minimum temperatures were significally above average. In addition scattered thunderstorms during the last ten days of the month helped to keep
flows up when the temperatures dropped. Therefore, observed streamflow for the month of May was 130 precent of average.
-Snowpack/Precipitation...On June 1st, the basinwide
snowpack
was 35 percent of average. May precipitation was 95 precent of average. The seasonal precipitation is average at this time.
-Short Term Precipitation Forecast...As of June 8th, meteorological models were predicting increased chances for below normal temperatures and above normal precipitation through
the middle of June.
-General Discussion...The April through July volume forecasts decreased from the May 1st issuance and now the guidance indicate runoff volumes from average to above average for the Yampa and White River basin.
Given the significant runoff in May and low June 1st snowpack, the June-July volume forecasts percentage-wise are much lower ranging from 56 percent of average for the White River near Watson to 92 percentage of average for the Little Snake
River near Dixon.
* Percent usable capacity, not percent average contents.
Click for multi-month Graph.
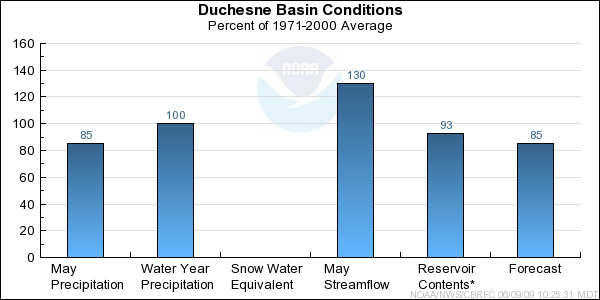
Duchesne Basin Conditions
-
Model Soil Moisture/Observed Streamflow...Fall soil conditions in the Duchesne were similar to the Upper Green with many basins indicating much below
average conditions. While the overall monthly average maximum temperatures during May in the Duchesne River basin were near normal, the monthly average minimum temperatures were significally above average.
Therefore, observed streamflow for the month of May was 130 percent of average.
-Snowpack/Precipitation...The
snowpack
in the Duchesne River basin on June 1st was essentially depleted. May precipitation was 85 percent of average. However, because previous months have received above average
precipitation, the seasonal precipitation is average at this time.
-Short Term Precipitation Forecast...As of June 8th, meteorological models were predicting increased chances for below normal temperatures and above normal precipitation through
the middle of June.
-General Discussion...Most of the April through July volume forecasts stayed the same as the May 1st issuance; however, a few increased and a few decreased reflecting the
diverse conditions within the basin. These forecasts range from average in the headwaters of the basin to much below average at downstream locations. Percentage-wise, the
June-July volume forecasts are much lower given that the snowpack is depleted.
* Percent usable capacity, not percent average contents.
Click for multi-month Graph.
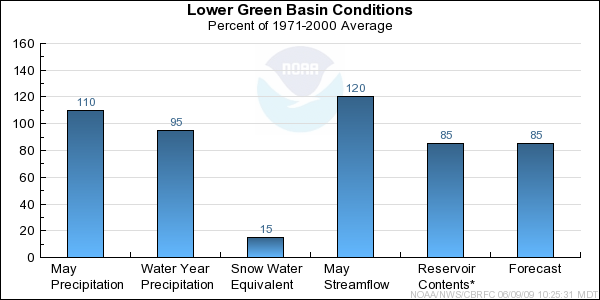
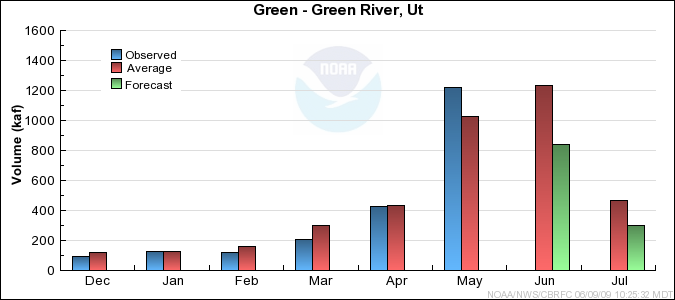
Lower Green Basin Conditions
-
Model Soil Moisture/Observed Streamflow...The November soil
moisture conditions were much below average in the Lower Green River basin and continues to drive lower model guidance. Observed streamflows for the months of February, March,
and April were below average. While the overall monthly average maximum temperatures during May in the Lower Green River basin were near normal, the monthly average minimum temperatures were significally above average.
Therefore, observed streamflow for the month of May was 120 percent of average.
-Snowpack/Precipitation...The Lower Green River basin
snowpack was 15 percent of average on June 1st. May precipitation was 110 percent of average. However, because previous months have received below average
precipitation, the seasonal precipitation is average at this time.
-Short Term Precipitation Forecast...As of June 8th, meteorological models were predicting increased chances for below normal temperatures and above normal precipitation through
the middle of June.
-General Discussion...Most of the April through July volume forecasts stayed the same as the May 1st issuance with the forecasts ranging from below average to near average with the exception of Ferron Creek forecasted at much below average.
Percentage-wise, the June-July volume forecasts are much lower given that the snowpack is almost depleted.
* Percent usable capacity, not percent average contents.
Click for multi-month Graph.
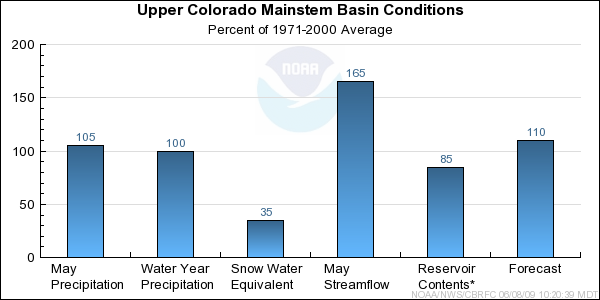
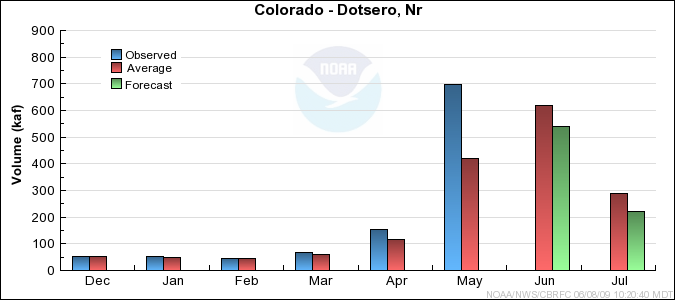
Upper Colorado Mainstem Basin Conditions
-Model Soil Moisture/Observed Streamflow...
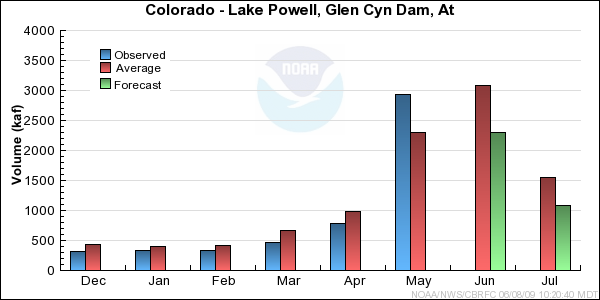
Soil moisture was near to above average in the Upper Colorado heading into the winter. May streamflow was 165% of average. According to the USGS, many sites had observed flows that were greater than the 75th percentile, with some above the 90th percentile, of the historical monthly flow and many of the unregulated volumes calculated by the CBRFC ranked in the top five historical volumes. While the overall monthly average maximum temperatures during May in the Upper Colorado basin were near normal, the monthly average minimum temperatures were significantly above average. In addition, widespread thunderstorms during the last ten days of the month helped to keep the flows up when the temperatures dropped.
-Snowpack/Precipitation... The basin-wide monthly precipitation for May was 105% of average. However, some of the headwater areas only received 80% of average while the Blue River drainage had 110% of average and areas near the bottom of the basin had close to 120% of average.
Snow water equivalent was 35% of average on Jun 1st and most of the remaining snow is above 11,000 feet.
-Short Term Precipitation Forecast... As of June 8th, meteorological models were predicting increased chances for below normal temperatures and above normal precipitation through the middle of June.
-General Discussion... Most of the April through July volume forecasts stayed the same or increased slightly from the May 1st issuance, and the forecasts now range between 56% of average on Mill Creek to 116% of average on Williams Fork. The June through July streamflow volume forecasts are much lower percentage-wise ranging between 43% and 92% of average since most of the snow had melted by June 1st.
* Percent usable capacity, not percent average contents.
Click for multi-month Graph.
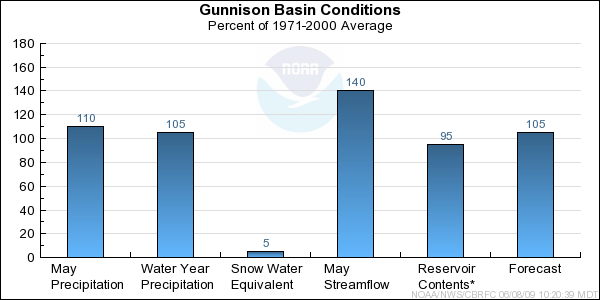
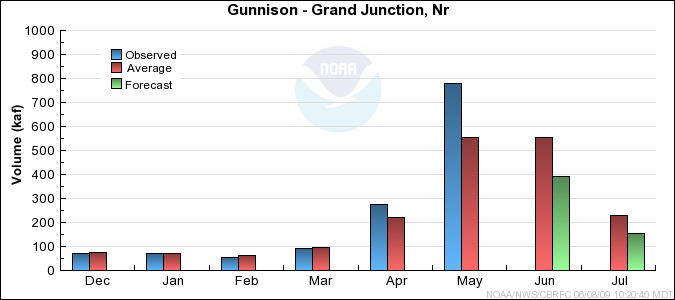
Gunnison Basin Conditions
-Model Soil Moisture/Observed Streamflow...
Soil moisture for most of the upper basins in the Gunnison was near to slightly below average in the fall.
Observed streamflow for the month of May was much above average for the Gunnison due to much above average temperatures during the first 7
to 14 days of May.
-Snowpack/Precipitation...The June 1st
snow water equivalent percent of average was 5 percent.
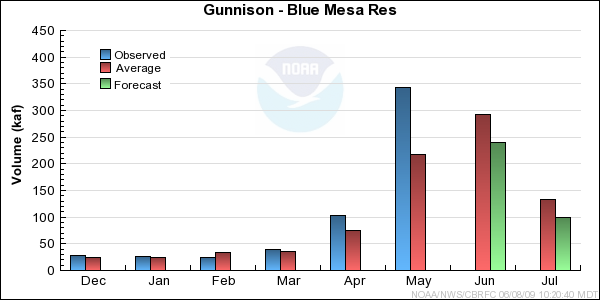
May precipitation for the upper Gunnison Basin was 120 percent of average. This was due to a week long period of convection with similarities to the monsoon.
This helped raise the April-July volume forecast at Blue Mesa 10 percent from last month's forecast. The entire Gunnison Basin received 110 percent of
average precipitation in May. Seasonal precipitation for the upper Gunnison was 110 percent of average while the entire Basin was 105 percent.
-Short Term Precipitation Forecast... As of June 8th, meteorological models were predicting increased chances for below normal temperatures and above normal
precipitation through the middle of June.
-General Discussion... April-July forecasts for the most part were raised 5-10 percent from last month's forecast. The median April-July forecast for the
Gunnison Basin increased to 105 percent of average.
* Percent usable capacity, not percent average contents.
Click for multi-month Graph.
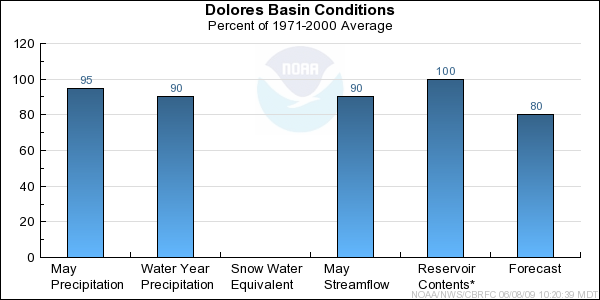
Dolores Basin Conditions
-Model Soil Moisture/Observed Streamflow...
Soil moisture for most of
the upper basins in the Dolores was below average in the fall. This was most likely due to limited monsoonal precipitation during the summer months. Observed
streamflow for the month of May was average for the Dolores.
-Snowpack/Precipitation... As of June 1st,
snow water equivalent
across the Dolores was 0 percent of average. The Dolores Basin recieved average precipitation for May, while seasonal precipitation for the Dolores Basin is at 90 percent of average.
-Short Term Precipitation Forecast... As of June 8th, meteorological models were predicting increased chances for below normal temperatures and above normal
precipitation through the middle of June.
-General Discussion... With much of the snow pack below 10,000 feet melted and stream flow being below average in the Dolores Basin, April-July volume
forecasts dropped around 3 to 5 percent from last month's forecast. The median April-July forecast is 80 percent of average.
* Percent usable capacity, not percent average contents.
Click for multi-month Graph.
San Juan Basin Conditions
* Percent usable capacity, not percent average contents.
Click for multi-month Graph.
Differences between the full period forecasts and the residual forecasts may not exactly equal the actual observed volumes due to rounding conventions (see Definitions section).
Reservoir Monthly Inflow Forecasts
Monthly Streamflows
Precipitation Maps
