Note: This publication is currently undergoing major revisions. The current publication will be replaced with a new publication based on stakeholder requirements and scientific advances. We expect to begin sharing details on this soon. If you have input on content, format, or publication frequency at any time, please contact us at cbrfc.webmasters@noaa.gov.Lake Powell Water Supply Outlook, June 1, 2010Lake Powell Water Supply Outlook, June 1, 2010
Contents
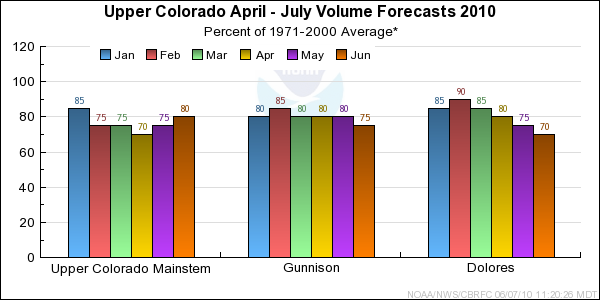
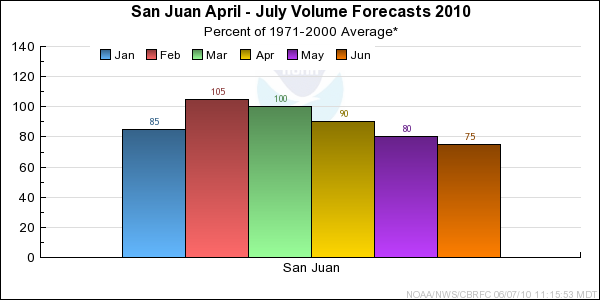
Lake Powell Sub-Basin Summaries

*Median of forecasts within each basin.
*Median of forecasts within each basin.
*Median of forecasts within each basin.
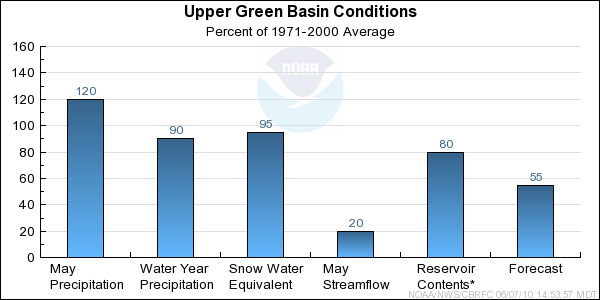
Upper Green Basin Conditions
The following conditions influenced this month's forecasts:
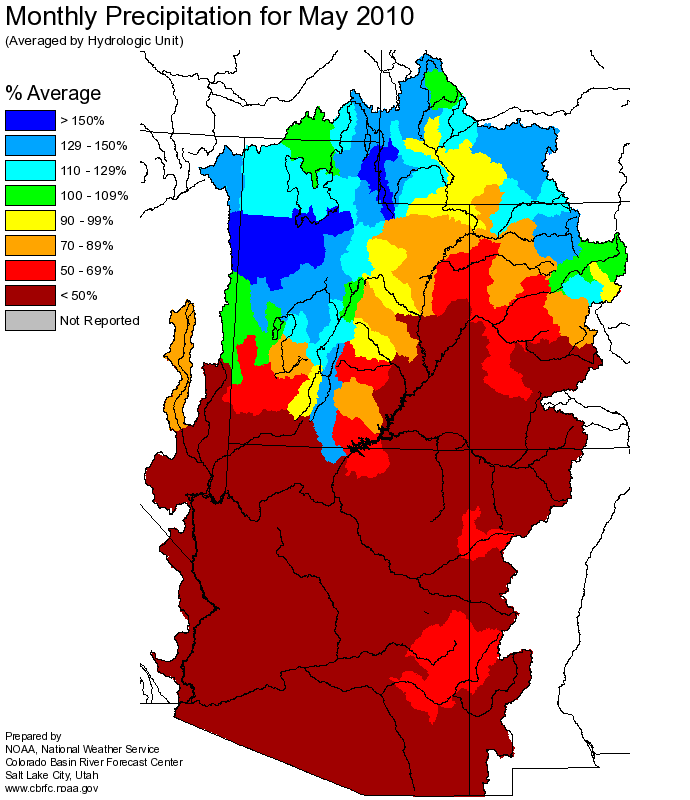
Precipitation:
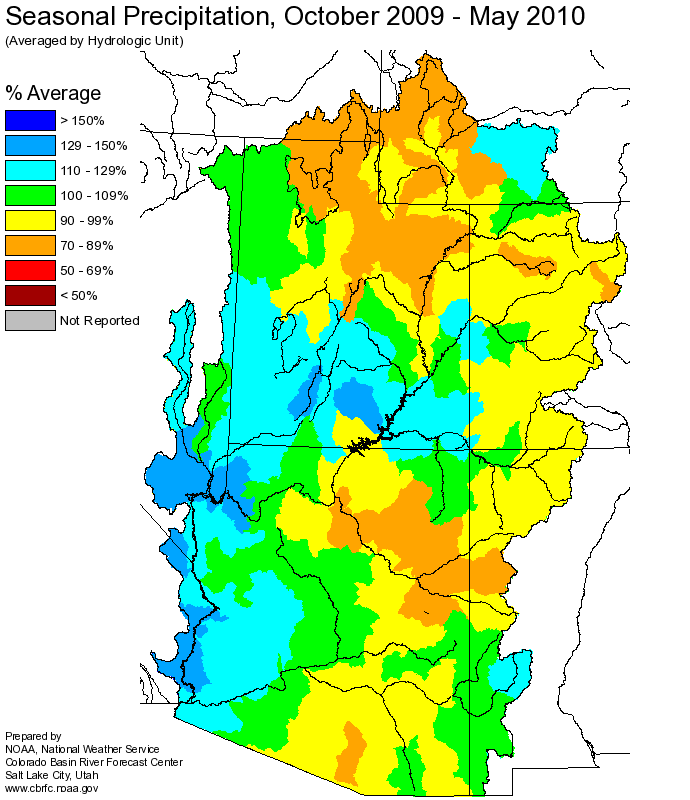
Seasonal October through May
precipitation was 90 percent of average
in the Upper Green basin. May
precipitation was 120 percent of average.
Snow:
On June 1st, the basinwide snowpack was 95 percent of average. However, the upper part of the basin, above 10,000 feet in elevation, is not gaged. The water year snowpack peaked on April
15th at much below the average peak.
--- Upper Green basin
snow
water equivalent plot.
Streamflow:
May streamflow was near 20 percent of average.
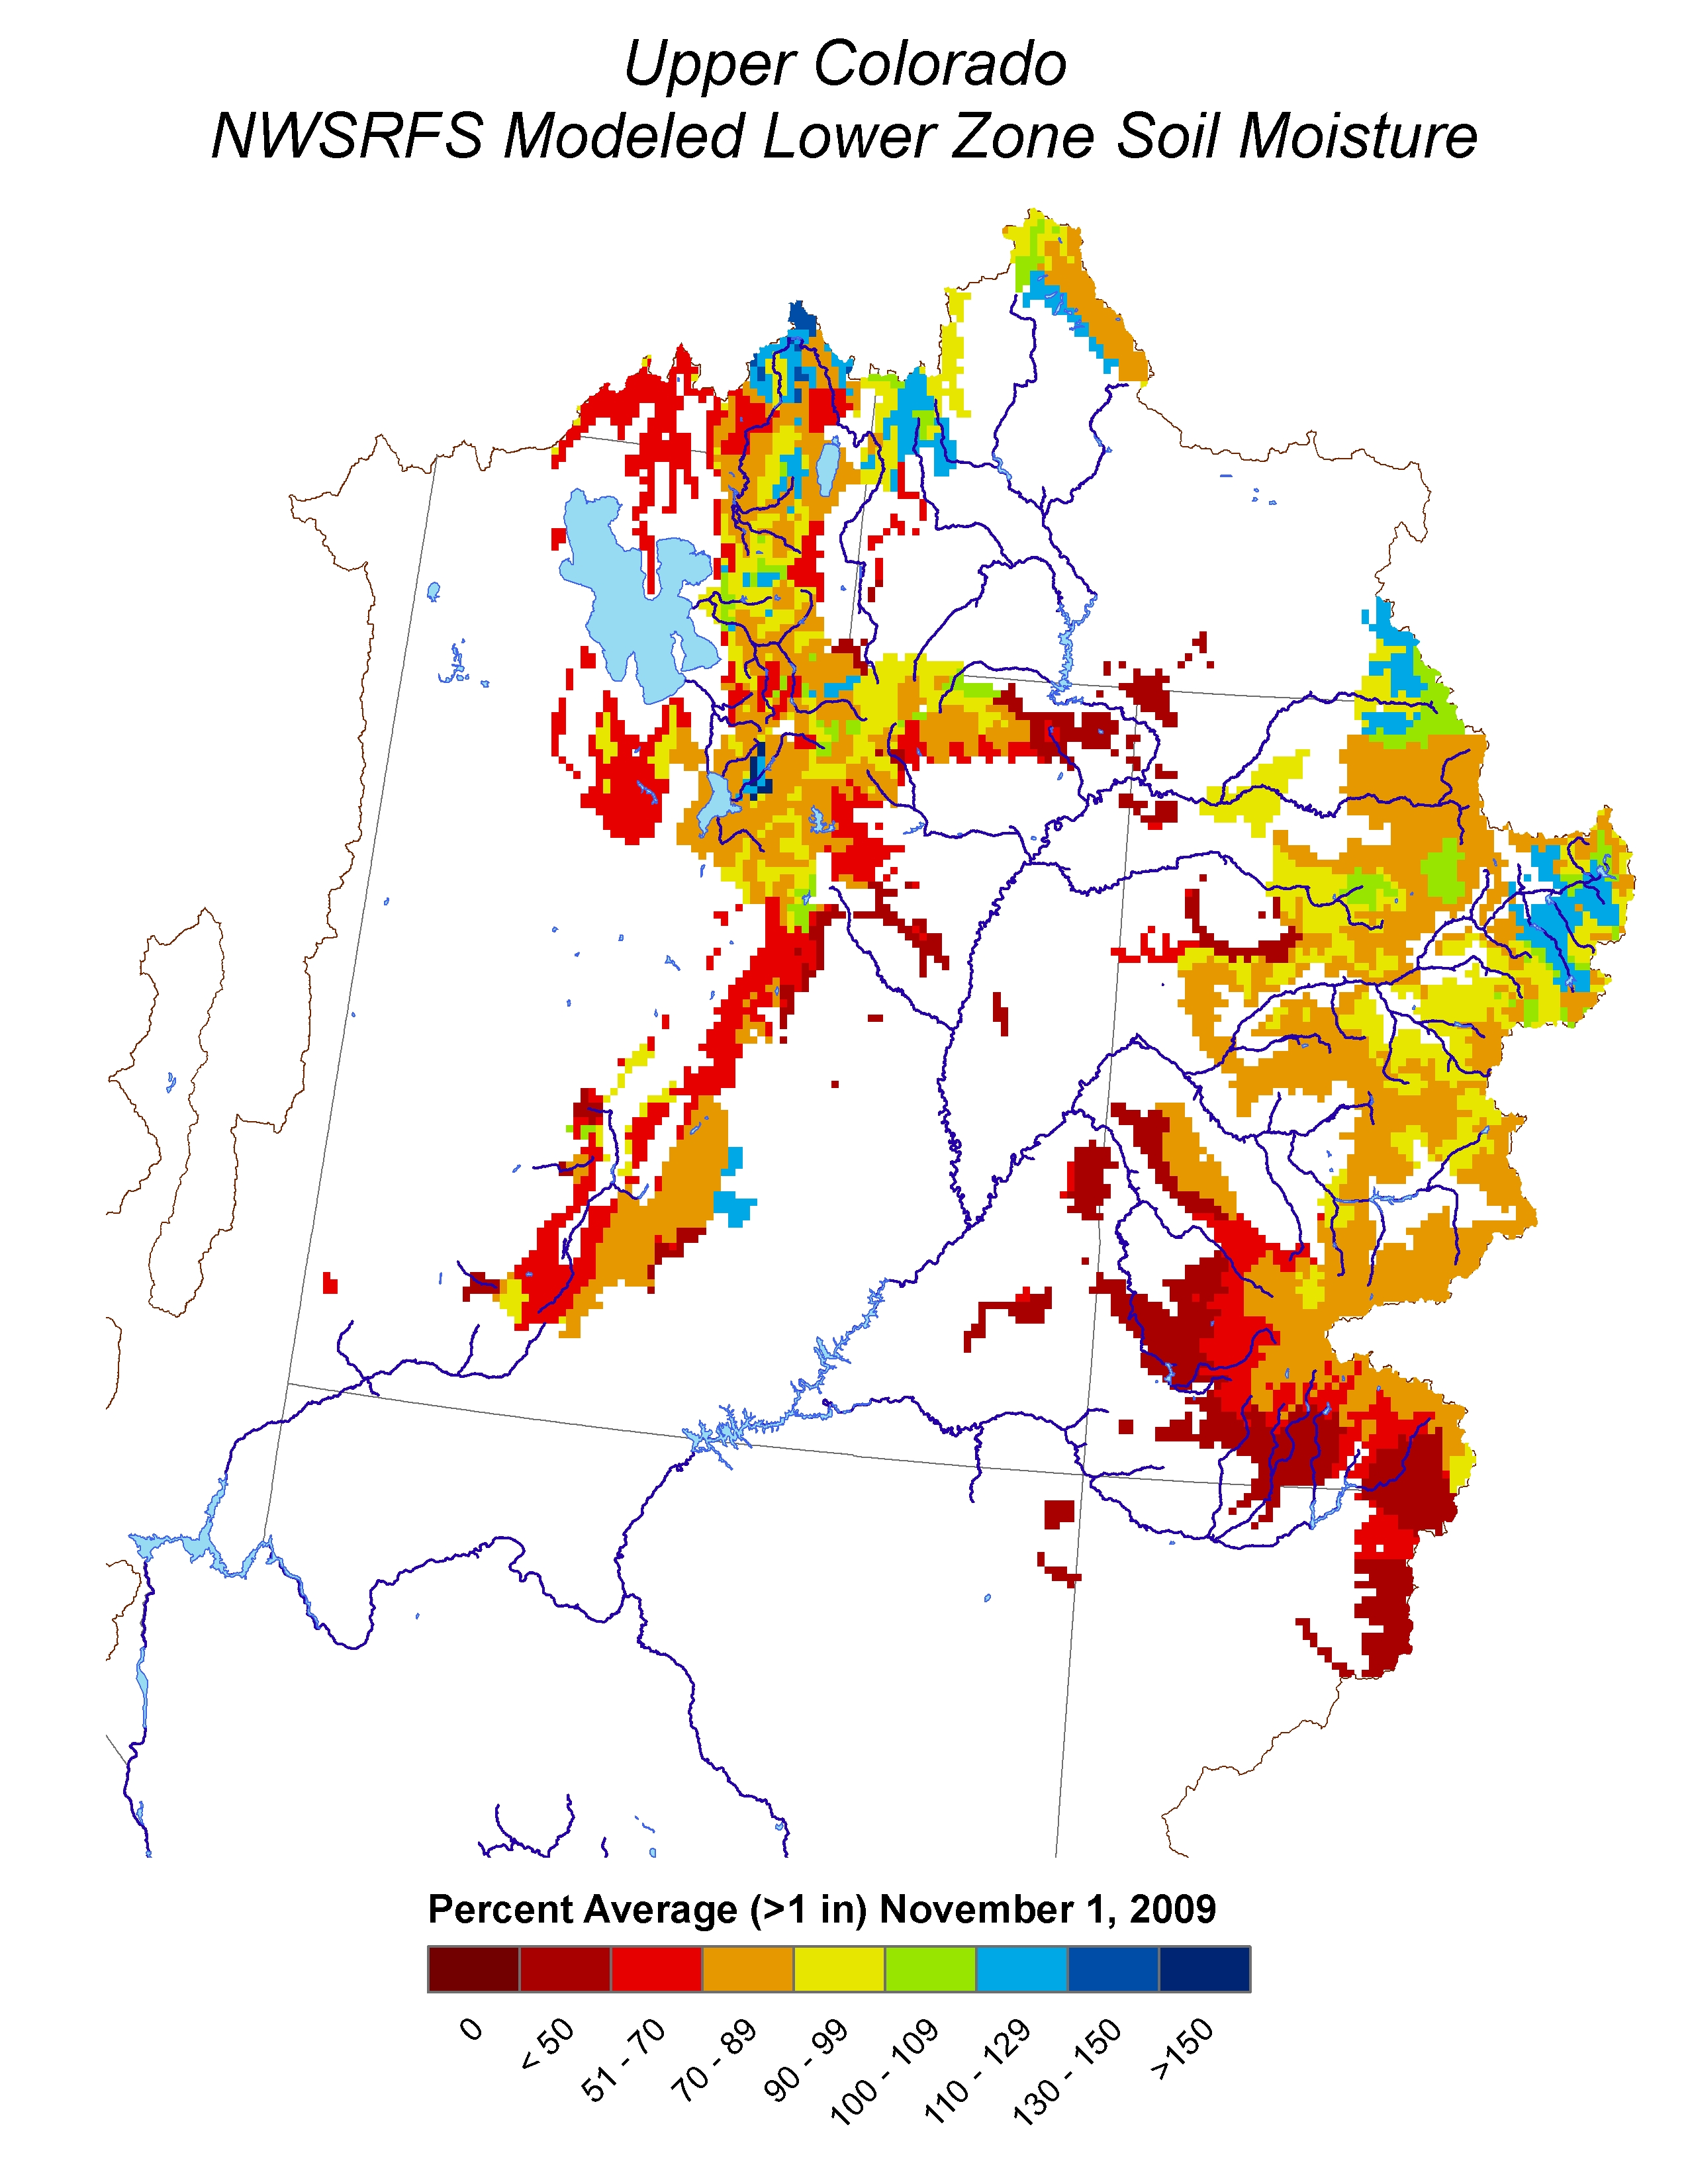
Soil Moisture:
Modeled
soil
moisture states ranged from below average to near average heading into the winter.
Climate Forecasts:
Climate forecasts were not a factor because there is not a strong correlation
between El Nino conditions and winter precipitation in the Upper Green basin.
Forecast Summary:
Due primarily to the much below average water year peak snowpack, the April through July streamflow volume forecasts are much below average. These
forecasts
range between 47 and 73 percent of average, with a median value of 55 percent. The June through July streamflow volume forecasts range between 54 and 82 percent of average, with
a median value of 60 percent.
* Percent usable capacity, not percent average contents.
Click for multi-month Graph.
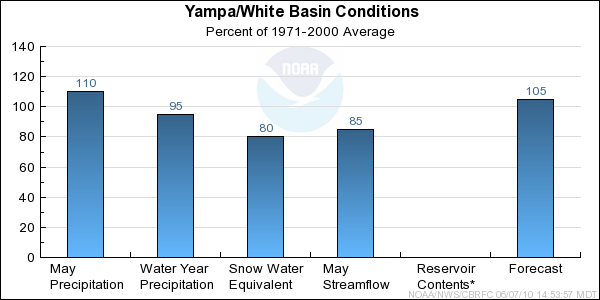
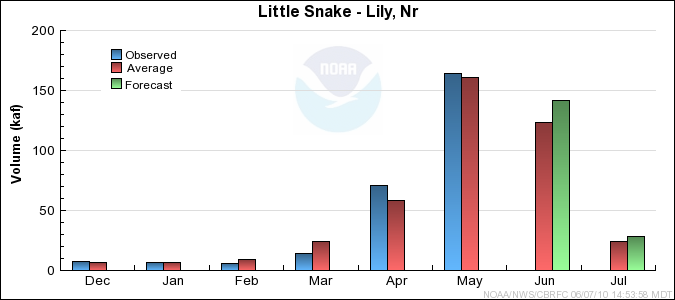
Yampa/White Basin Conditions
The following conditions influenced this month's forecasts:
Precipitation:
Seasonal October through May
precipitation was 95 percent of average
in the Yampa/White basin. May
precipitation was 110 percent of average.
Snow:
June 1st snow water equivalent was 80 percent of average in the basin as a whole. The seasonal snowpack peaked on April 10th at 80 percent of the average peak. This year cooler
temperatures retained some of the snowpack later into the season.
--- Yampa basin
snow
water equivalent plot.
Streamflow:
May streamflow was near 85 percent of average.
Soil Moisture:
Modeled
soil
moisture states were near average heading into the winter for the Little Snake
and White River basins. Modeled states ranged from below average to near average
heading into winter for the Yampa basin.
Climate Forecasts:
Climate forecasts were not a factor because there is not a strong correlation
between El Nino conditions and winter precipitation in the Yampa/White basin.
Forecast Summary:
Due to the near average precipitation to date, and because some of the snowpack was retained later into the season because of cooler temperatures, the April through July streamflow volume forecasts are near average at this time. These
forecasts range
between 54 and 128 percent of average, with a median value of 105 percent. The June through July streamflow volume forecasts range between 51 and 115 percent of average, with
a median value of 80 percent.
* Percent usable capacity, not percent average contents.
Click for multi-month Graph.
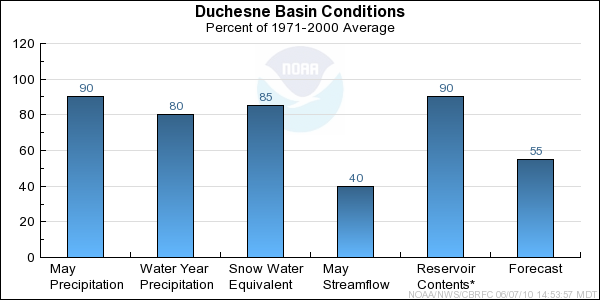
Duchesne Basin Conditions
The following conditions influenced this month's forecasts:
Precipitation:
Seasonal October through May
precipitation was 80 percent of average
in the Duchesne basin. May
precipitation was 90 percent of average.
Snow:
June 1st snow water equivalent was 85 percent of average in the basin as a whole.
--- Duchesne basin
snow
water equivalent plot.
Streamflow:
May streamflow was near 40 percent of average.
Soil Moisture:
Modeled
soil
moisture states were much below average to below average heading into the winter.
Climate Forecasts:
Climate forecasts were not a factor because there is not a strong correlation
between El Nino conditions and winter precipitation in the Duchesne basin.
Forecast Summary:
Due to below average water year precipitation, below average seasonal snowpack, and much below average soil moisture heading into winter, the April through July streamflow
volume forecasts continue to be much below average. These
forecasts range between 34 and 76 percent of average,
with a median value of 55 percent. The June through July streamflow volume forecasts range between 25 and 73 percent of average, with
a median value of 65 percent.
* Percent usable capacity, not percent average contents.
Click for multi-month Graph.
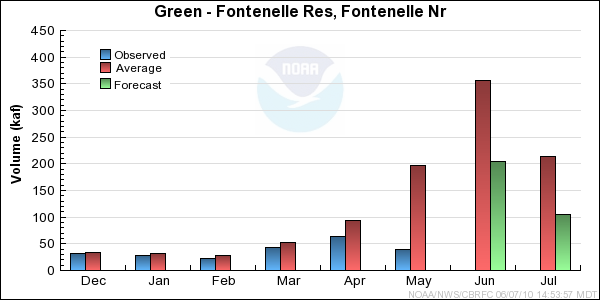
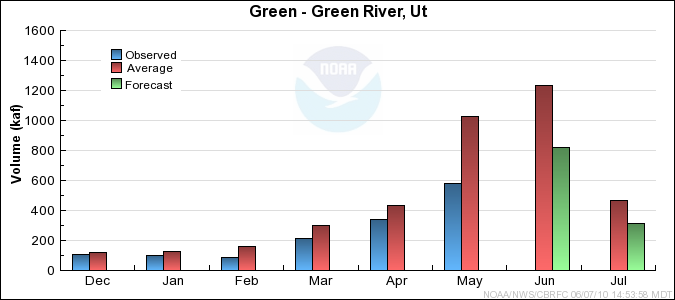
Lower Green Basin Conditions
The following conditions influenced this month's forecasts:
Precipitation:
Seasonal October through May
precipitation was 95 percent of average
in the headwaters of the Lower Green basin. May
precipitation was 90 percent of average.
Snow:
June 1st snow water equivalent was 50 percent of average in the Price and San Rafael basin. Elsewhere within the Lower Green the snow was essentially depleted.
--- Price basin
snow
water equivalent plot.
Streamflow:
May streamflow was near 50 percent of average.
Soil Moisture:
Modeled
soil
moisture states were much below average heading into the winter.
Climate Forecasts:
Climate forecasts were not a factor because there is not a strong correlation
between El Nino conditions and winter precipitation in the Lower Green basin.
Forecast Summary:
Due to the below average seasonal snowpack, and the much below average soil moisture heading into winter,
the April through July streamflow volume forecasts continue to be much below average. These
forecasts
range between 32 and 61 percent of average, with a median value of 45 percent. The June through July streamflow volume forecasts range between 45 and 65 percent of average, with
a median value of 50 percent.

* Percent usable capacity, not percent average contents.
Click for multi-month Graph.
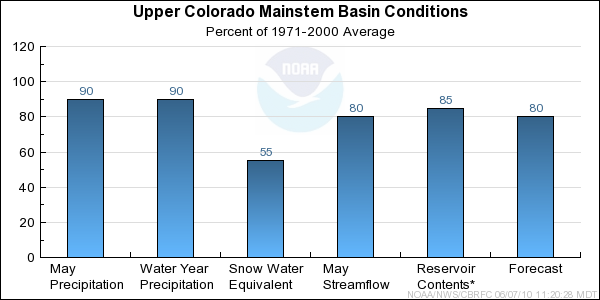
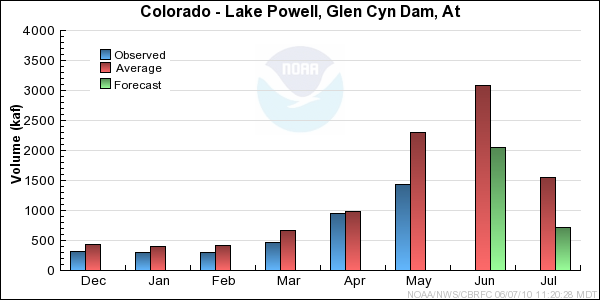
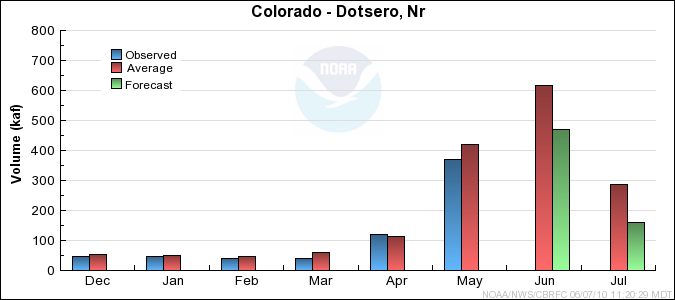
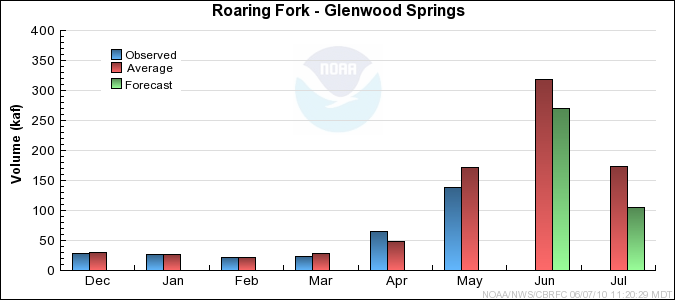
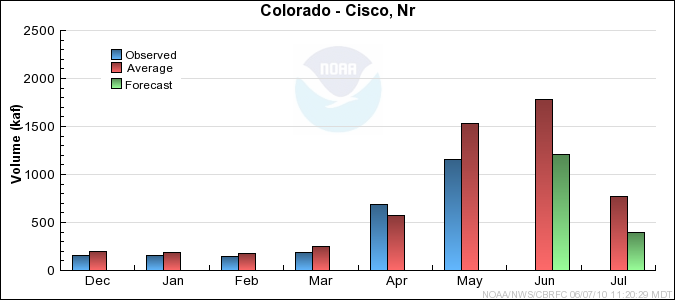
Upper Colorado Mainstem Basin Conditions
The following conditions influenced this month's forecasts:
Precipitation:
Seasonal October through May
precipitation
was near 90 percent of average in the Upper Colorado mainstem basin.
May
precipitation was also near 90 percent of average.
Snow:
June 1st snow water equivalent was near 55 percent of average in the basin
as a whole. The majority of the remaining snow is above 10,000 feet. The snow
peaked in May at 85% of the average seasonal peak.
--- Upper Colorado basin
snow
water equivalent plot
Streamflow:
May streamflow was near 80 percent of average.
Soil Moisture:
Modeled
soil
moisture states were near average heading into the winter.
Forecast Summary:
Basin wide precipitation was near average for the month of May. However, some headwater
areas received greater amounts of precipitation. June through July streamflow volume forecasts
range from 43 to 85 percent of average,with a median value of 69%. April through July
streamflow volume forecasts remained the same or increased slightly in certain headwater areas.
The Upper Colorado basin April through July streamflow volume forecasts now range
from 58 to 85 percent of average, with a median value of 72%.
* Percent usable capacity, not percent average contents.
Click for multi-month Graph.
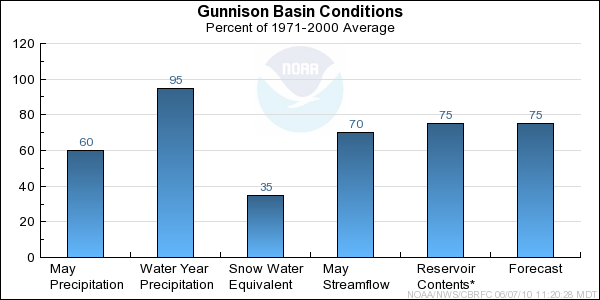
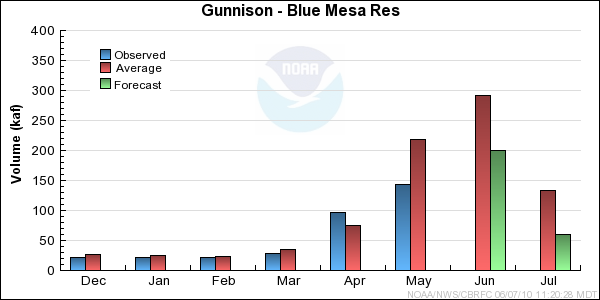
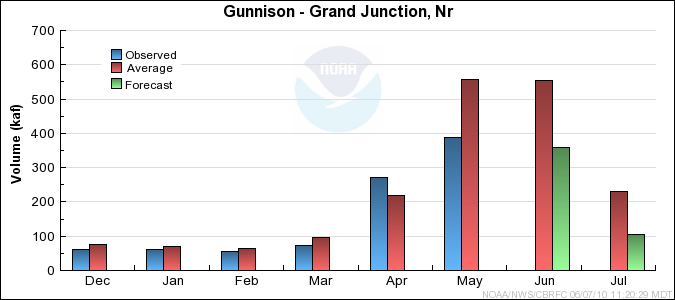
Gunnison Basin Conditions
The following conditions influenced this month's forecasts:
Precipitation:
Seasonal October through May
precipitation was 95 percent of average
in the Gunnison Basin. May
precipitation was 60 percent of average.
Snow:
June 1st snow water equivalent was 35 percent of average in the Gunnison Basin. There is still some snow
above 11,500 feet with minimal areal extent. The snow peaked above Blue Mesa in early April around 95
percent of the seasonal average.
--- Gunnison basin
snow
water equivalent plot
Streamflow:
May streamflow was 70 percent of average.
Soil Moisture:
Modeled
soil
moisture states were below average heading into the winter.
Forecast Summary:
May precipitation was much below average in the Gunnison Basin, as were the monthly
streamflow volumes. Also, June 1st snow water equivalent for the Gunnison dropped to 35 percent
below average. June through July volume forecasts range from 56 to 69 percent of
average, with a median value of 62%. This resulted in a 5 percent decrease to the
April through July volume forecasts. The Gunnison Basin April through July
forecasts now range
between 66 and 86 percent of average, with a median value of 74%.
* Percent usable capacity, not percent average contents.
Click for multi-month Graph.
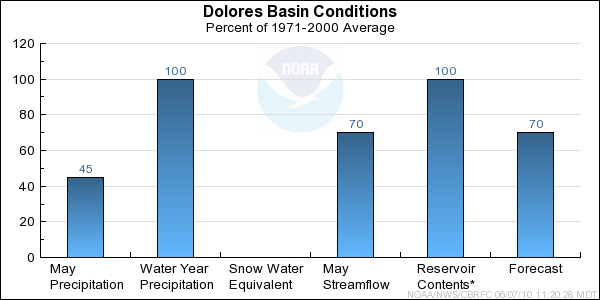
Dolores Basin Conditions
The following conditions influenced this month's forecasts:
Precipitation:
Seasonal October through May
precipitation was 100 percent of average
in the entire Dolores Basin. May
precipitation was 45 percent of average.
Snow:
June 1st snow water equivalent was 0 percent of average in the Dolores Basin. However, there is still
enough snow above 11,500 feet with minimal areal extent for
some runoff into June. The snow peaked in early April at about 110 percent of the seasonal average.
--- Dolores basin
snow
water equivalent plot
Streamflow:
May streamflow was 70 percent of average.
Soil Moisture:
Modeled
soil
moisture states were below to much below average heading into the winter.
Forecast Summary:
May precipitation was much below average in the Dolores Basin. In addition, the May 1st snow water
equivalent was below average at 0%, but still some snow was left above 11,500 feet for runoff into June.
June through July volume forecasts range from 30 to 53 percent of average, with a median value of 34%.
This resulted in about a 5% decrease in the April through July forecast volumes.
The Dolores Basin April through July
forecasts now range between
67 and 72 percent of average, with a median value of 69%.
* Percent usable capacity, not percent average contents.
Click for multi-month Graph.
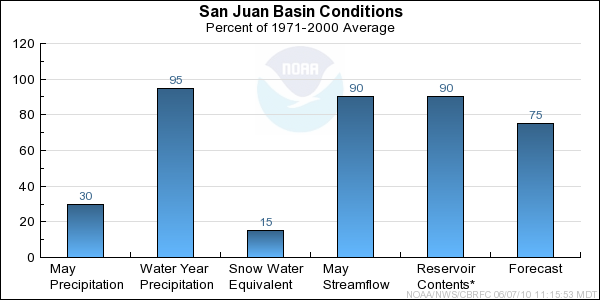
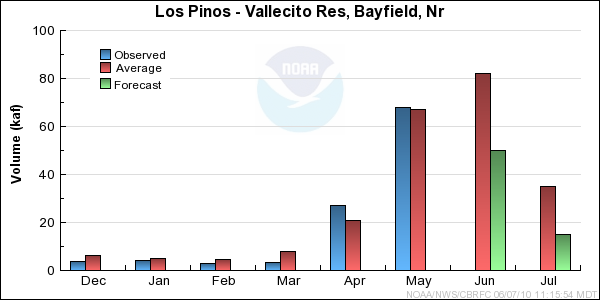
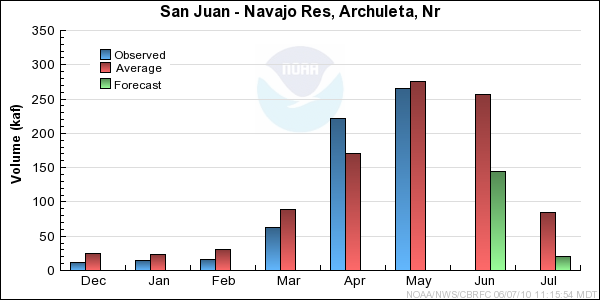
San Juan Basin Conditions
The following conditions influenced this month's forecasts:
Precipitation:
Seasonal October through May
precipitation was 95
percent of average in the San Juan Basin.
May
precipitation was 30 percent of average.
Snow:
As of June 1st, most snow at SNOTEL locations in the San Juan Basin were at zero. However, there is still enough snow above 11,500 feet for some
runoff for the remainder June. The snow peaked in early April at around 110% of the average seasonal peak.
--- Animas River Basin
Snow Plot.
--- Above Navajo Basin
Snow Plot.
Streamflow:
Streamflow for the entire San Juan Basin was 90 percent of average in May.
Seasonal streamflow since October was 65% due to the much below average summer
through fall precipitation.
Soil Moisture:
Modeled
soil
moisture as of November 1st, 2009 was below to much below average.
Forecast Summary:
May precipitation was much below average in the San Juan Basin and the June 1st snow
water equivalent was much below average as well. June through July volume forecasts range from 37 percent to 67
percent of average with a median value of 55%. The much below average precipitation in May resulted in
5% to 10% decreases at most points for the April through July forecast volumes. The San Juan Basin
April through July
forecasts now range between 70 and 91 percent of
average, with a median value of 75%.
* Percent usable capacity, not percent average contents.
Click for multi-month Graph.
Differences between the full period forecasts and the residual forecasts may not exactly equal the actual observed volumes due to rounding conventions (see Definitions section).
Reservoir Monthly Inflow Forecasts

Monthly Streamflows


Precipitation Maps
