10% exceedance forecast: Given the current hydrometeorological conditions, i.e current snowpack, soil moisture and streamflow, the volume that has a 10% chance of being exceeded. Previously referred to as "Reasonable Maximum Forecast".
50% exceedance forecast: Given the current hydrometeorological conditions, i.e current snowpack, soil moisture and streamflow, the volume that has a 50% chance of being exceeded. Previously referred to as "Most Probable Forecast".
90% exceedance forecast: Given the current hydrometeorological conditions, i.e current snowpack, soil moisture and streamflow, the volume that has a 90% chance of being exceeded. Previously referred to as "Reasonable Minimum Forecast".
Acre-Foot (af):
The volume equal to one acre covered one foot deep (43,560 cubic feet). See kaf below.
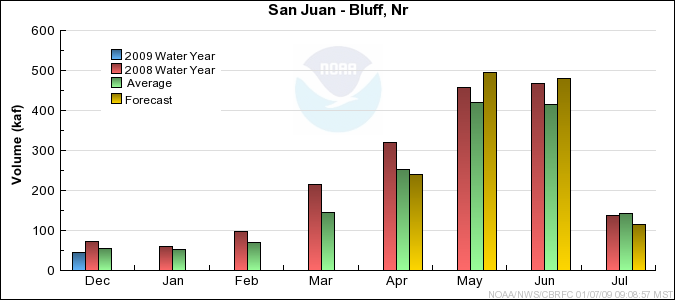
Average:
The arithmetic mean. The sum of the values divided by the number of values. Values from 1971-2000 are used for this publication.
Categories:
Much Above Average=Greater than 130%, Above Average=111-130%, Near Average=90-110%, Below Average=70-89%, Much Below Average=Less than 70%.
CBRFC:
Colorado Basin River Forecast Center.
Forecast Period:
The period from April 1 through July 31, unless otherwise noted.
kaf:
Thousand Acre-Feet. See Acre-Foot above.
Inflow:
The volume of water that flows into a reservoir or lake.
Median:
The middle value of an ordered set of values. Half of the values are higher and half of the values are lower. When the set contains an even number of values the median is the average of the two middle numbers.
NOAA:
National Oceanic and Atomospheric Administration.
NWS:
National Weather Service.
Rounding Conventions:
| Range | | Round to |
| 0-1.99 | | 0.01 |
| 2.0-19.9 | | 0.1 |
| 20-199 | | 1.0 |
| 200-999 | | 5.0 |
| 1000+ | | 3 significant digits |
Streamflow:
The volume of water that flows past a specific stream site.
Water Year:
The 12-month period, October 1 through September 30. The water year is designated by the calendar year in which it ends. Thus, the year ending September 30, 2008, is called the "2008 water year."
Water supply forecasts take into consideration present hydrometeorological conditions and use
average basin temperatures and precipitation for the forecast period. As the forecast season progresses,
a greater portion of the future hydrologic and climatic uncertainty becomes known and
monthly forecasts become more accurate. For more information on the tools we use, consult
Water Supply Forecasting Tools.
Volume forecasts represent adjusted flows; that is, observed flows with upstream water use
taken into account. Adjusted flows will closely approximate natural or unimpaired flows.
However, not all upstream diversions or impoundments are measured or quantifiable. For specific
adjustments used with each forecast point, consult the
Guide to Water Supply Forecasting.
The Water Supply Outlook is issued monthly January through May by the Colorado Basin River
Forecast Center. It represents a coordinated effort between the
National Weather Service, Natural Resources Conservation Service, Bureau of Reclamation, U.S.
Geological Survey and local water district managers.
Note: Data used in this report are provisional and are subject to revision.
For more information, or to be included on the mailing list, please contact:
Colorado Basin River Forecast Center
2242 W North Temple
Salt Lake City, UT 84116
(801) 524-5130
www.cbrfc.noaa.gov