The following conditions influenced this month's forecasts:
Precipitation:
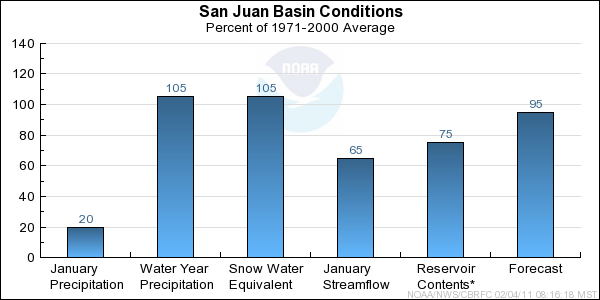
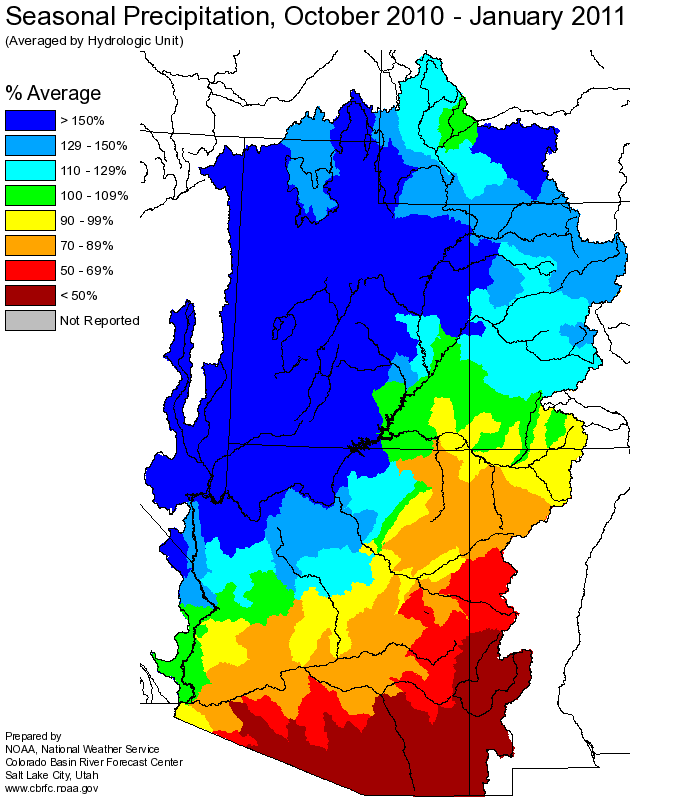
Seasonal October through January
precipitation amounts dropped from last month to near average, 105%, due to the very dry month of
January.
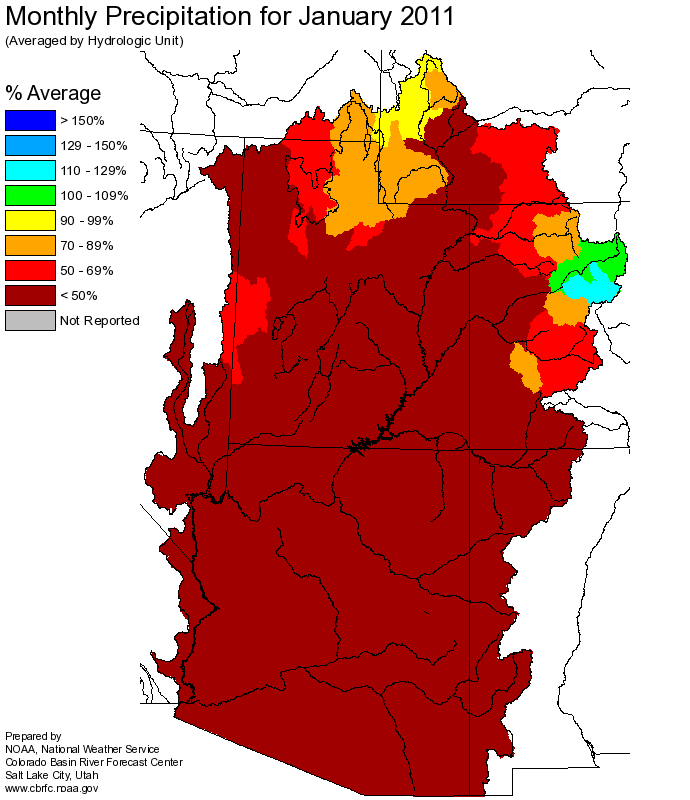
January
precipitation was 20 percent of average, which was much below average.
Snow:
Current snow water equivalent for the entire basin is 105%, which is near average. The Animas basin is similar with 110%, while above Navajo
snow water equivalent was 95 percent of average. All three dropped significantly since January 1st.
--- Animas River Basin
Snow Plot.
--- Above Navajo Basin
Snow Plot.
Streamflow:
Streamflow for the entire San Juan Basin was below average for January at 65%. Seasonal streamflow since October
continued to be below average at 65%, due to the much below average fall precipitation.
Soil Moisture:
Modeled
soil
moisture as of November 1st, 2010 was average to below average across the entire San Juan Basin.
Climate Forecasts:
The correlation of La Nina and April through July water volumes in the San Juan basin does suggest slightly drier than average December through May precipitation,
but it did not influence the February forecast process.
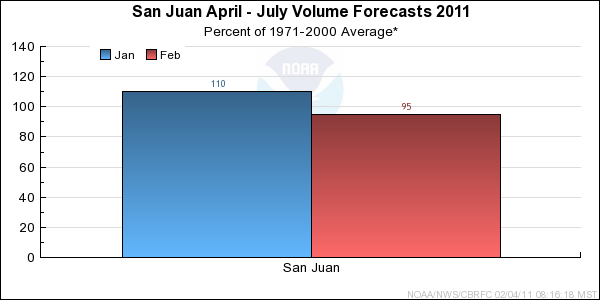
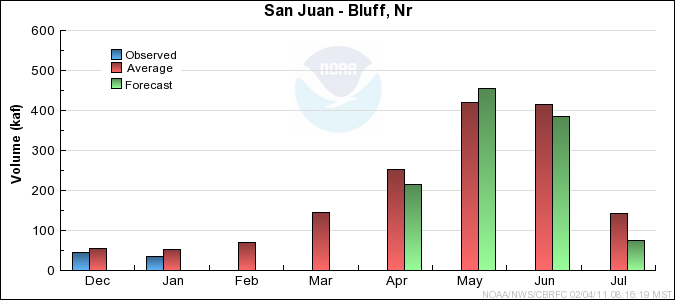
Forecast Summary:
Seasonal precipitation and current snowpack have dropped to average values compared to last month. Also, soil moisture conditions before
the winter season were near average in the upper basin. This drove the San Juan Water Supply
April-July forecast down to a median value of 95 percent.
Differences between the full period forecasts and the residual forecasts may not exactly equal the actual observed volumes due to rounding conventions (see Definitions section).