The following conditions influenced this month's forecasts:
Precipitation:
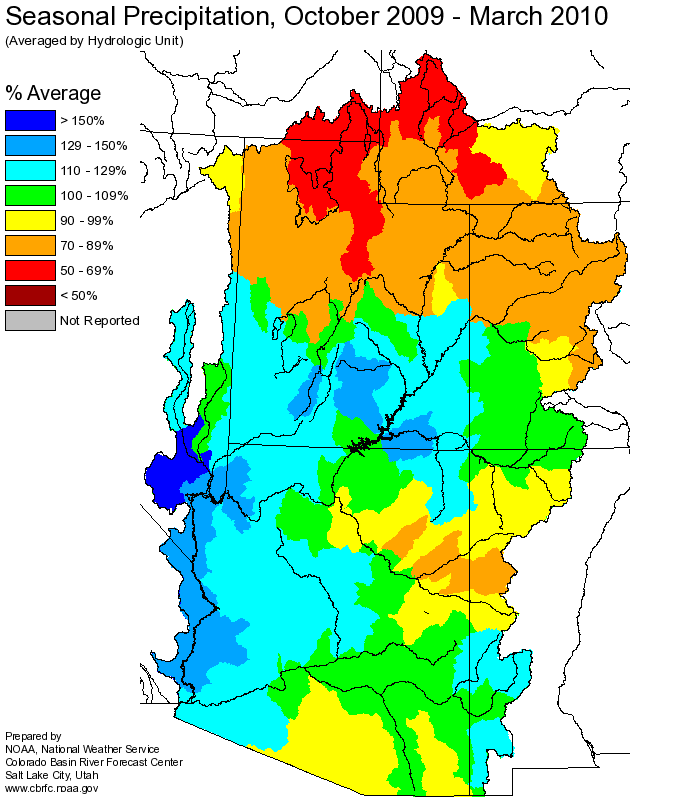
Seasonal October through March
precipitation amounts dropped from last month,
but remained near average at 105%.
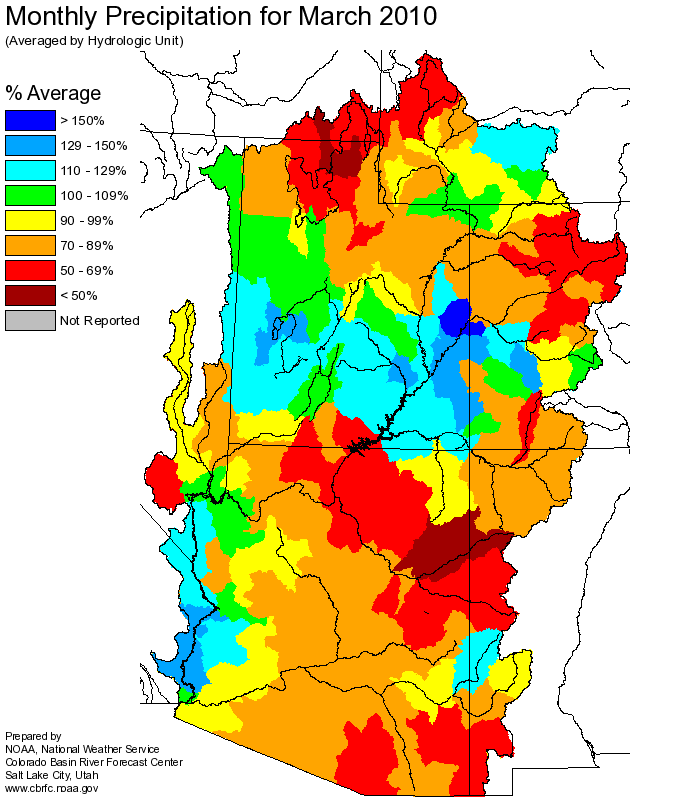
March
precipitation was below average with 70%.
Snow:
Current snow water equivalent for the entire basin dropped from last month and is now 100%, which is near average. The Animas basin
snow water equivalent dropped as well and is now 95% percent of average. The above Navajo snow water equivalent dropped also from last month and is
average with 100%.
--- Animas River Basin
Snow Plot.
--- Above Navajo Basin
Snow Plot.
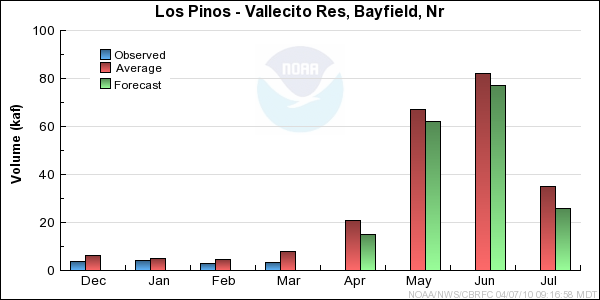
Streamflow:
Streamflow for the entire San Juan Basin was below average in March. Seasonal streamflow since October
was 55% due to the much below average summer through fall precipitation.
Soil Moisture:
Modeled
soil
moisture as of November 1st, 2009 was below to much below average.
Climate Forecasts:
The correlation of El Nino and April through July water volumes in the San Juan basin is so small that
it did not influence the forecast process.
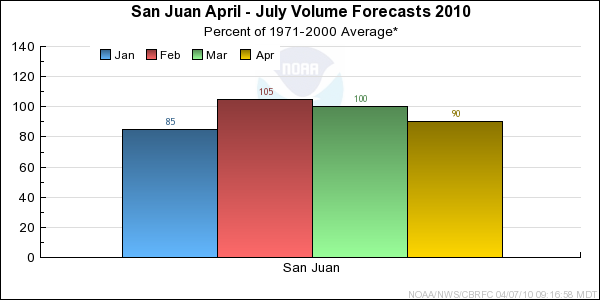
Forecast Summary:
Current snowpack conditions decreased slightly in March, but remained near average. Monthly precipitation for March was only 70% of average basin wide.
This helped drive the San Juan Water Supply April-July forecast down 10% from the previous month to 90% of average.
Differences between the full period forecasts and the residual forecasts may not exactly equal the actual observed volumes due to rounding conventions (see Definitions section).