The following conditions influenced this month's forecasts:
Precipitation:
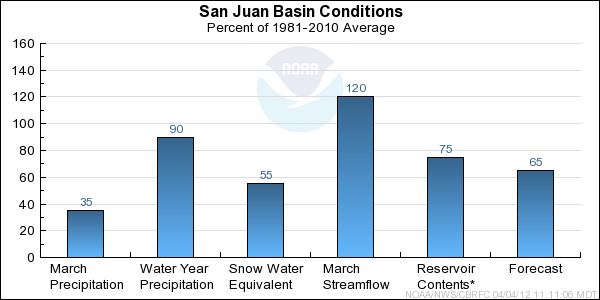
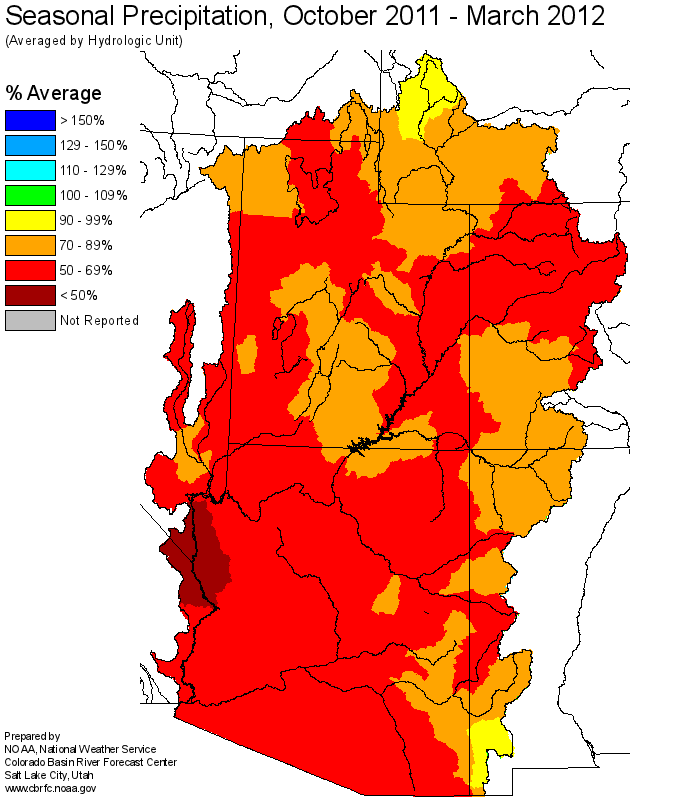
Seasonal October through March
precipitation was 90 percent of average in the San Juan Basin.
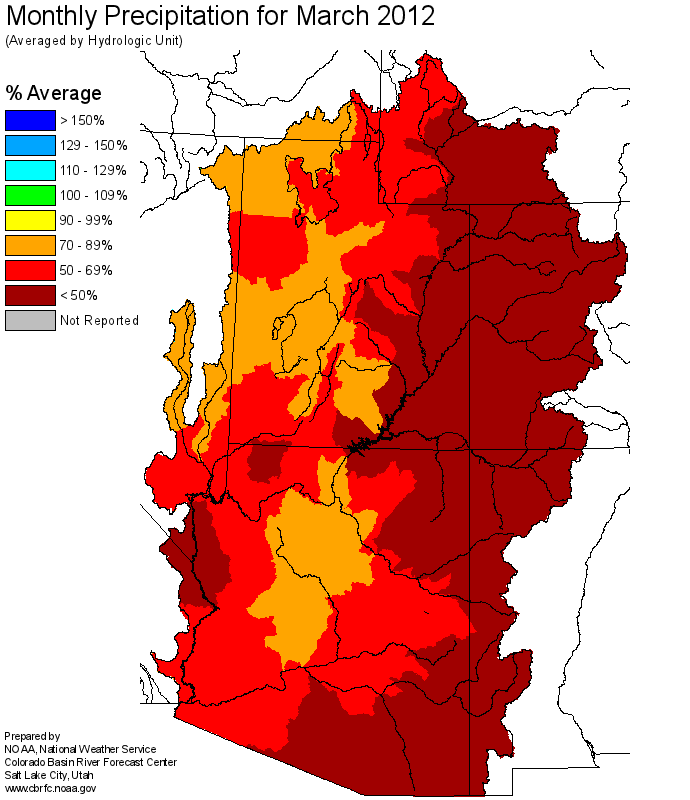
March
precipitation was 35 percent of average in the San Juan Basin. At individual locations
the March precpitation ranged from near 15 to 55 percent of average.
Snow:
April 1st snow water equivalent for the entire basin was near 55 percent of average, and ranged from 30 to 70 percent
of average at individual sites. An early onset of the snow melt occurred at all elevation levels due to much above
average temperatures in March.
Animas River Basin
Snow Plot.
San Juan Basin (above Navajo Reservoir)
Snow Plot.
Streamflow:
Streamflow volumes were above average for March due to the early snow melt. Runoff volumes ranged from near 110 to 140 percent
of average at most locations with 165 percent of average on the Florida River.
Soil Moisture:
Modeled
soil moisture was near to above
average at highest elevations entering the winter season. Below average soil moisture conditions existed
over the southern half of the basin and in tributaries further downstream.
Climate Forecasts:
La Nina climate conditions existed through the winter months. The La Nina climate condition suggests drier
than average conditions possible over the San Juan Basin. The La Nina climate condition was considered when
developing the forecasts.
Forecast Summary:
Seasonal precipitation, October through March, was near 90 percent of average. Snow melt occurred at all elevations
due to dry and warm conditions in March. By April 1st the San Juan Basin snow water equivalent was reduced to 55 percent
of average with some sites reporting less than 30 percent of average. Soil moisture varied
entering the winter season, with near or slightly above average conditions in high elevations in the northern headwaters,
and below average conditions elsewhere. La Nina climate conditions suggest below average precipitation possible over
the San Juan Basin through spring.
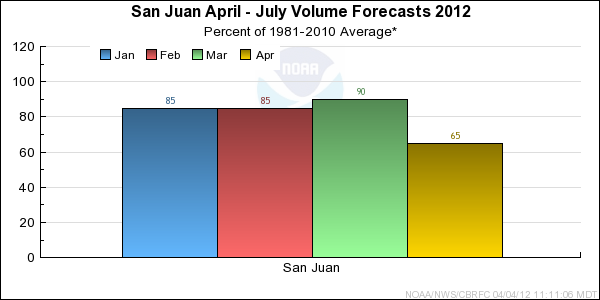
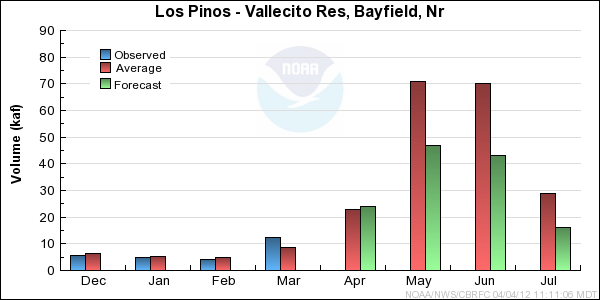
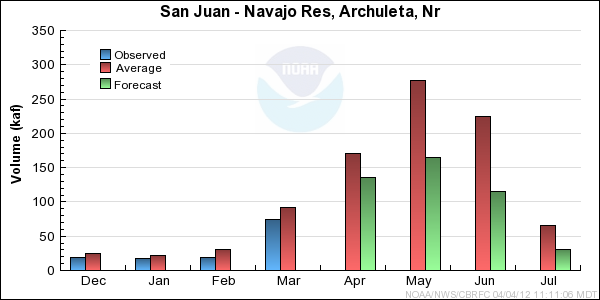
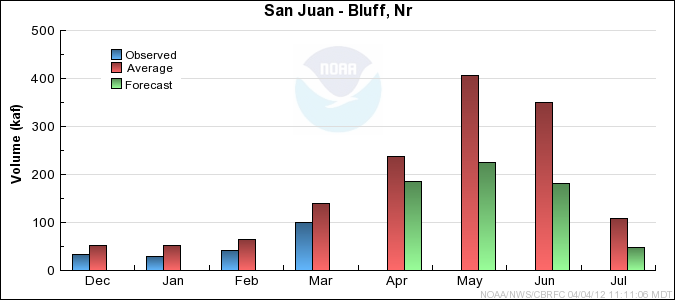
Streamflow forecasts were reduced significantly from those issued March 1st.
April-July
runoff volumes are expected to range from 55 to 75 percent of the 1981-2010 average.
Differences between the full period forecasts and the residual forecasts may not exactly equal the actual observed volumes due to rounding conventions (see Definitions section).