-Model Soil Moisture/Observed Streamflow...
Soil moisture
for most of the upper basins in the San Juan were below average last fall. This was most likely due
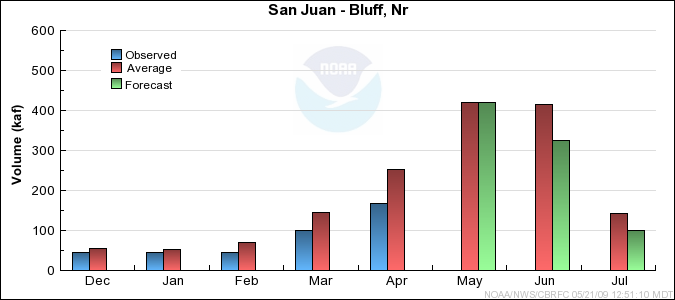
to limited monsoonal precipitation over the summer months. Observed streamflow for the month of April
was near average in the upper portions of the basin, but below normal in the lower San Juan.
-Snowpack/Precipitation...
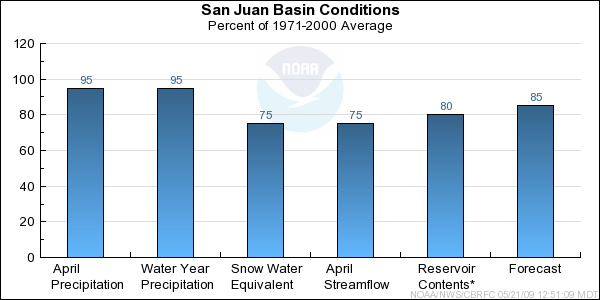
Snow water equivalent
for the entire San Juan Basin on May 1st was 75 percent of average.
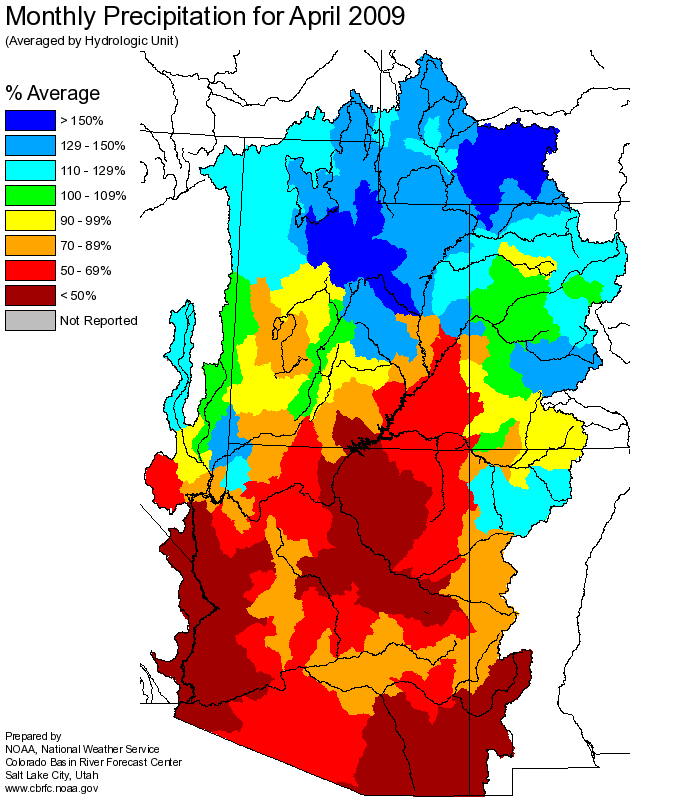
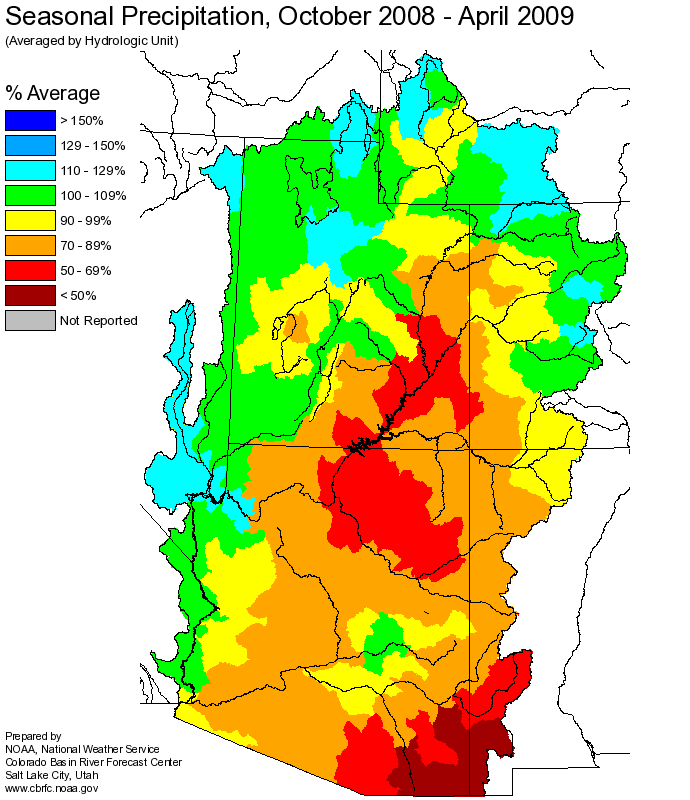
After three months of much below normal precipitation, the San Juan Basin recieved 95 percent of average
precipitation during April. Due to the extremely wet December, seasonal precipitation has stayed
near average and is currently 95 percent of average.
-Short Term Precipitation Forecast... As of May 6th, meteorological models were predicting increased
chances for above normal temperatures and below normal precipitation through the middle of May.
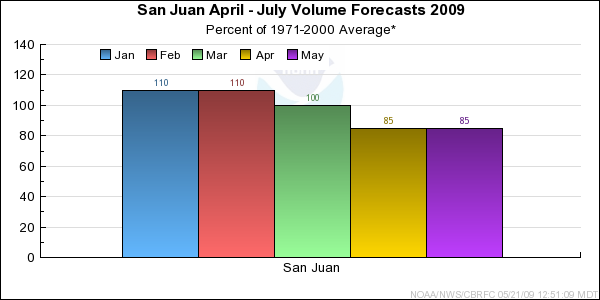
-General Discussion...Due to the below average soil moisture in the upper basin this fall and the
combination of current snowpack conditions and April observed flow, the median April-July forecast
for the San Juan Basin is 85 percent of average. All forecasts are exactly the same as those issued
April 1st. The median of the May-July forecasts is also 85 percent of average.
Differences between the full period forecasts and the residual forecasts may not exactly equal the actual observed volumes due to rounding conventions (see Definitions section).