Note: This publication is currently undergoing major revisions. The current publication will be replaced with a new publication based on stakeholder requirements and scientific advances. We expect to begin sharing details on this soon. If you have input on content, format, or publication frequency at any time, please contact us at cbrfc.webmasters@noaa.gov.San Juan Water Supply Outlook, June 1, 2009

San Juan Water Supply Outlook, June 1, 2009


Prepared by Tracy Cox
NOAA, National Weather Service
Colorado Basin River Forecast Center
Salt Lake City, Utah
www.cbrfc.noaa.gov

Contents

San Juan Summary

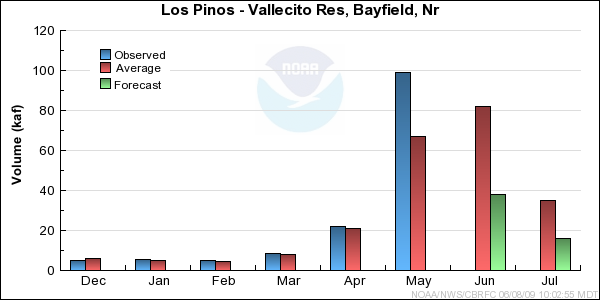
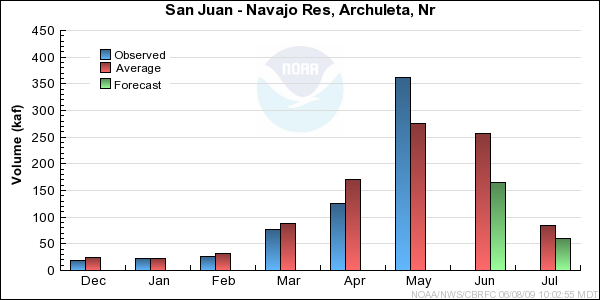
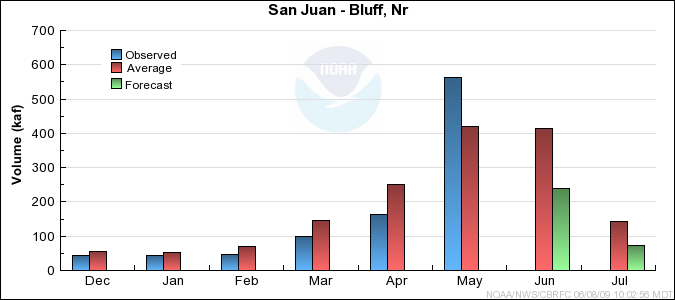
-Model Soil Moisture/Observed Streamflow...Soil moisture for most of the upper basins in the San Juan were below average last fall. This was most likely due to limited monsoonal precipitation over the summer months. Observed streamflow for the month of May was much above average for most portions of the San Juan Basin due to much above average temperatures during the first 7 to 14 days of May.

-Snowpack/Precipitation...
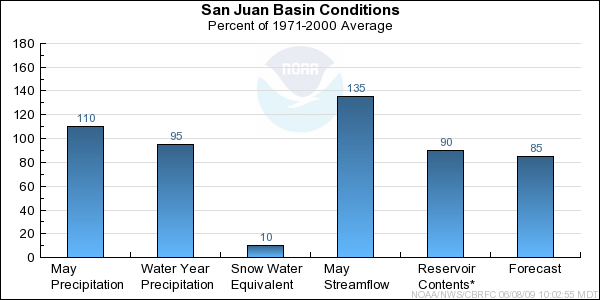
Snow water equivalent for the entire San Juan Basin on June 1st was 10 percent of average with the remaining snow well above 11,000 feet. 
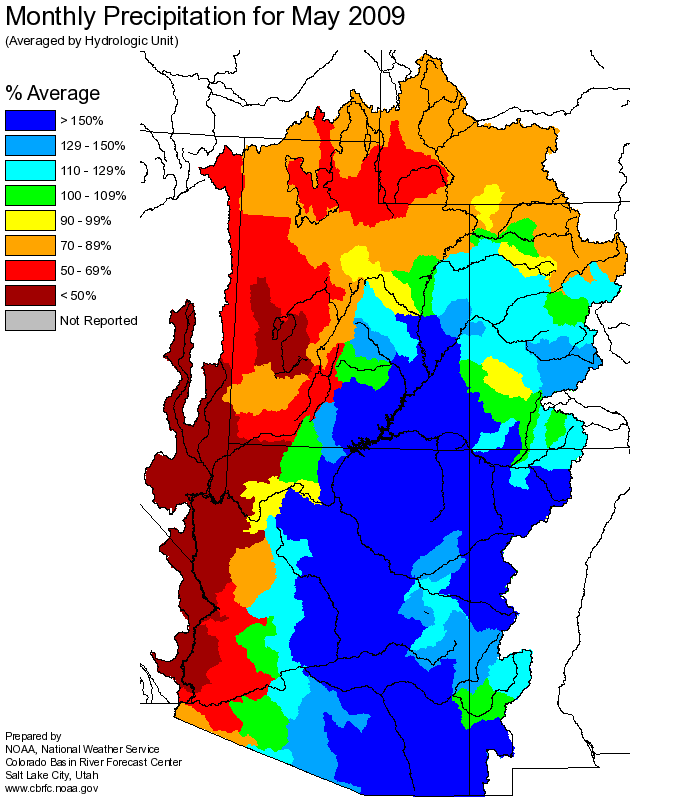
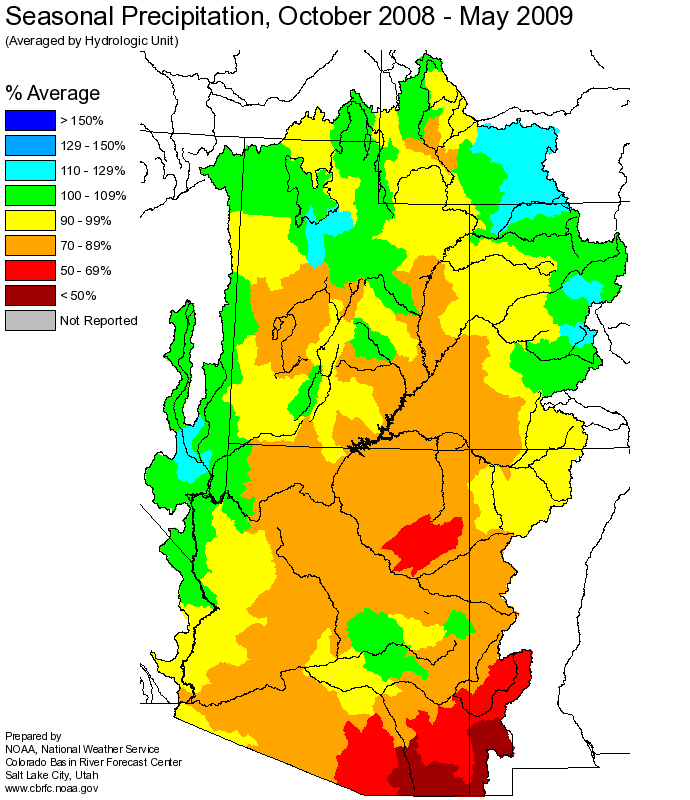
The upper San Juan Basin recieved near to above average precipitation during May, while the lower portions recieved much above normal amounts. This was due to an approximate week long convective outbreak that had similarities to the monsoon. This wet period in May, combined with the extremely wet December, has kept seasonal precipitation to 95 percent of average for the entire Basin.

-Short Term Precipitation Forecast... As of June 8th, meteorological models were predicting increased chances for below normal temperatures and above normal precipitation through the middle of June.

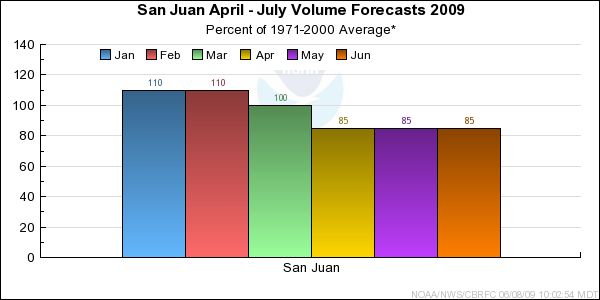
-General Discussion...Due to the below average soil moisture in the upper basin this fall and the combination of current snowpack conditions and May observed flow, the median April-July forecast for the San Juan Basin is 85 percent of average. The median of the June-July forecasts is 55 percent of average since most of the snow pack has melted off.


*Median of forecasts within each basin.


San Juan Basin Conditions


* Percent usable capacity, not percent average contents.
Click for multi-month Graph.


San Juan Specific Site Forecasts (kaf)

Click site name for graph.
Forecast
Period
90%
Exceedance
Volume
50%
Exceedance
Volume
Percent
Average
10%
Exceedance
Volume
San Juan
Pagosa Springs April-July205235104265
June-July528172110
Carracas, Nr April-July35039096440
June-July9313472186
Navajo Res, Archuleta, Nr April-July65571090770
June-July17022566285
Farmington April-July8751060881180
June-July28532056385
Bluff, Nr April-July8851040851150
June-July16031556425
Rio Blanco
Pagosa Springs, Nr, Blanco Dam, Blo April-July485310060
June-July10.415.36122
Navajo
Chromo, Nr, Oso Div Dam, Blo April-July60679776
June-July16.5247133
Piedra
Arboles, Nr April-July17319083210
June-July38556277
Los Pinos
Vallecito Res, Bayfield, Nr April-July16017585194
June-July39544773
Animas
Durango April-July34038086435
June-July8112249175
Florida
Lemon Res, Durango, Nr April-July40457852
June-July6.811.83618.8
La Plata
Hesperus April-July14.6197624
June-July1.53.7346.2
Mancos
Mancos, Nr April-July1617.55319.3
June-July0.251.710.43.5
South Ck
Lloyds Rsvr Nr Monticello, Abv March-July0.210.3220.46

Differences between the full period forecasts and the residual forecasts may not exactly equal the actual observed volumes due to rounding conventions (see Definitions section).

Reservoir Monthly Inflow Forecasts


San Juan Reservoir Contents (kaf)

Usable
Capacity
EOM
Contents
Percent
Usable
Capacity
Last Year
EOM
Last Year
%Capacity
untitled Los Pinos
Vallecito Res, Bayfield, Nr 125.4 124.1 99 81.7 65
untitled San Juan
Navajo Res, Archuleta, Nr 1701.3 1515.1 89 1419.9 83
untitled Florida
Lemon Res, Durango, Nr 39.8 39.4 99 34.5 87
untitled
TOTAL 1866.5 1678.6 90 1536.1 82

Monthly Streamflows


Precipitation Maps


Definitions

10% exceedance forecast: Given the current hydrometeorological conditions, i.e current snowpack, soil moisture and streamflow, the volume that has a 10% chance of being exceeded. Previously referred to as "Reasonable Maximum Forecast".

50% exceedance forecast: Given the current hydrometeorological conditions, i.e current snowpack, soil moisture and streamflow, the volume that has a 50% chance of being exceeded. Previously referred to as "Most Probable Forecast".

90% exceedance forecast: Given the current hydrometeorological conditions, i.e current snowpack, soil moisture and streamflow, the volume that has a 90% chance of being exceeded. Previously referred to as "Reasonable Minimum Forecast".

Acre-Foot (af): The volume equal to one acre covered one foot deep (43,560 cubic feet). See kaf below.

Average: The arithmetic mean. The sum of the values divided by the number of values. Values from 1971-2000 are used for this publication.

Categories: Much Above Average=Greater than 130%, Above Average=111-130%, Near Average=90-110%, Below Average=70-89%, Much Below Average=Less than 70%.

CBRFC: Colorado Basin River Forecast Center.

Forecast Period: The period from April 1 through July 31, unless otherwise noted.

kaf: Thousand Acre-Feet. See Acre-Foot above.

Inflow: The volume of water that flows into a reservoir or lake.

Median: The middle value of an ordered set of values. Half of the values are higher and half of the values are lower. When the set contains an even number of values the median is the average of the two middle numbers.

NOAA: National Oceanic and Atomospheric Administration.

NWS: National Weather Service.

Rounding Conventions:
RangeRound to
0-1.990.01
2.0-19.90.1
20-1991.0
200-9995.0
1000+3 significant digits


Streamflow: The volume of water that flows past a specific stream site.

Water Year: The 12-month period, October 1 through September 30. The water year is designated by the calendar year in which it ends. Thus, the year ending September 30, 2008, is called the "2008 water year."


Additional Information

Water supply forecasts take into consideration present hydrometeorological conditions and use average basin temperatures and precipitation for the forecast period. As the forecast season progresses, a greater portion of the future hydrologic and climatic uncertainty becomes known and monthly forecasts become more accurate. For more information on the tools we use, consult Water Supply Forecasting Tools.

Volume forecasts represent adjusted flows; that is, observed flows with upstream water use taken into account. Adjusted flows will closely approximate natural or unimpaired flows. However, not all upstream diversions or impoundments are measured or quantifiable. For specific adjustments used with each forecast point, consult the Guide to Water Supply Forecasting.

The Water Supply Outlook is issued monthly January through May by the Colorado Basin River Forecast Center. It represents a coordinated effort between the National Weather Service, Natural Resources Conservation Service, Bureau of Reclamation, U.S. Geological Survey and local water district managers.

Note: Data used in this report are provisional and are subject to revision.

For more information, or to be included on the mailing list, please contact:

Colorado Basin River Forecast Center
2242 W North Temple
Salt Lake City, UT 84116
(801) 524-5130
www.cbrfc.noaa.gov


Hydrologist: Tracy Cox