NOAA, National Weather Service
Colorado Basin River Forecast Center
Salt Lake City, Utah
www.cbrfc.noaa.gov
| Prepared by Tracy Cox NOAA, National Weather Service Colorado Basin River Forecast Center Salt Lake City, Utah www.cbrfc.noaa.gov |
| Forecast Period | 90% Exceedance Volume | 50% Exceedance Volume | Percent Average | 10% Exceedance Volume | |
| San Juan | |||||
| Pagosa Springs | April-July | 172 | 181 | 80 | 190 |
| June-July | 55 | 64 | 57 | 73 | |
| Carracas, Nr | April-July | 315 | 350 | 86 | 390 |
| June-July | 79 | 112 | 60 | 153 | |
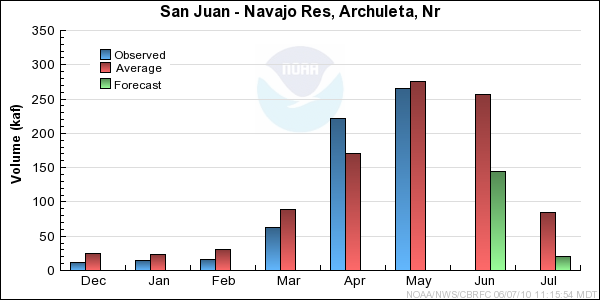
| Navajo Res, Archuleta, Nr | April-July | 605 | 650 | 83 | 700 |
| June-July | 120 | 165 | 49 | 215 | |
| Farmington | April-July | 900 | 930 | 77 | 980 |
| June-July | 235 | 265 | 46 | 315 | |
| Bluff, Nr | April-July | 840 | 900 | 73 | 975 |
| June-July | 165 | 225 | 40 | 300 | |
| Rio Blanco | |||||
| Pagosa Springs, Nr, Blanco Dam, Blo | April-July | 41 | 46 | 87 | 52 |
| June-July | 11.7 | 16.8 | 67 | 23 | |
| Navajo | |||||
| Chromo, Nr, Oso Div Dam, Blo | April-July | 51 | 57 | 83 | 64 |
| June-July | 16.1 | 22 | 65 | 29 | |
| Piedra | |||||
| Arboles, Nr | April-July | 197 | 210 | 91 | 225 |
| June-July | 34 | 47 | 53 | 62 | |
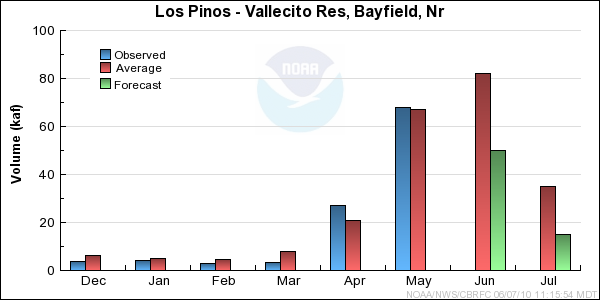
| Los Pinos | |||||
| Vallecito Res, Bayfield, Nr | April-July | 144 | 160 | 78 | 180 |
| June-July | 49 | 65 | 56 | 85 | |
| Animas | |||||
| Durango | April-July | 280 | 320 | 73 | 370 |
| June-July | 99 | 138 | 55 | 186 | |
| Florida | |||||
| Lemon Res, Durango, Nr | April-July | 39 | 43 | 74 | 49 |
| June-July | 10.2 | 15 | 45 | 21 | |
| La Plata | |||||
| Hesperus | April-July | 16.4 | 17.8 | 71 | 19.6 |
| June-July | 2.9 | 4.3 | 39 | 6.1 | |
| Mancos | |||||
| Mancos, Nr | April-July | 21 | 23 | 70 | 25 |
| June-July | 4 | 6 | 37 | 8.5 | |
| South Ck | |||||
| Lloyds Rsvr Nr Monticello, Abv | March-July | 1.2 | 1.3 | 95 | 1.5 |
| Usable Capacity | EOM Contents | Percent Usable Capacity | Last Year EOM | Last Year %Capacity | |
|
| |||||
| Vallecito Res, Bayfield, Nr | 125.4 | 112.9 | 90 | 124.1 | 99 |
|
| |||||
| Navajo Res, Archuleta, Nr | 1701.3 | 1505.7 | 89 | 1515.1 | 89 |
|
| |||||
| Lemon Res, Durango, Nr | 39.8 | 31.5 | 79 | 39.4 | 99 |
|
| |||||
| TOTAL | 1866.5 | 1650.1 | 88 | 1678.6 | 90 |
| Range | Round to | |
| 0-1.99 | 0.01 | |
| 2.0-19.9 | 0.1 | |
| 20-199 | 1.0 | |
| 200-999 | 5.0 | |
| 1000+ | 3 significant digits |