The following conditions influenced this month's forecasts:
Precipitation:
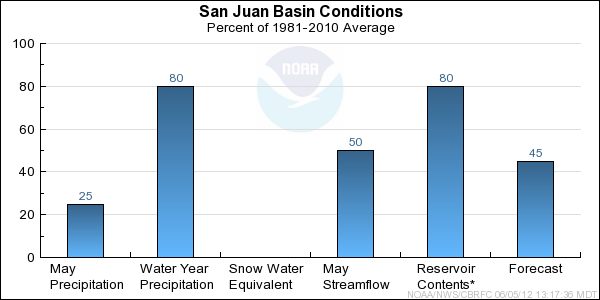
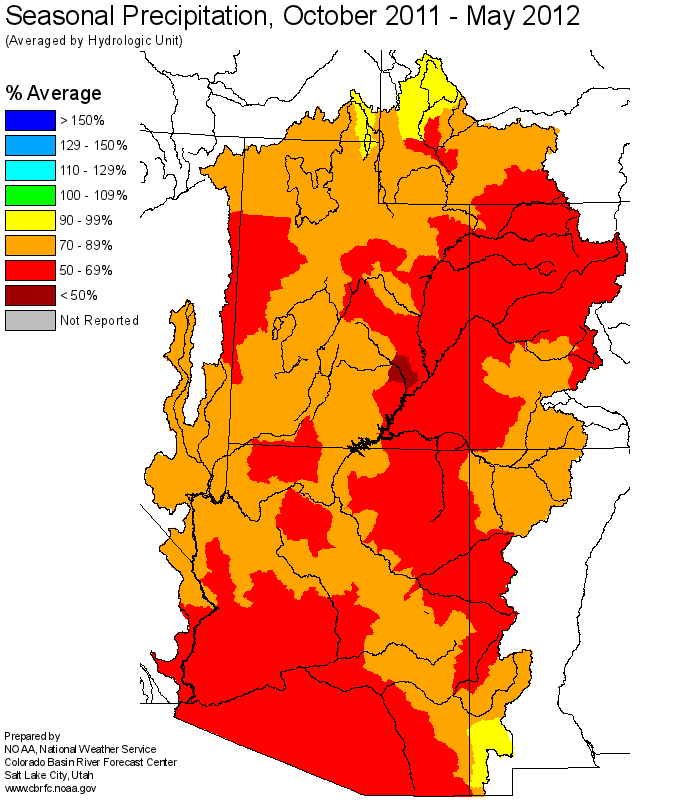
Seasonal October through May
precipitation was between 65 to 85 percent of average at
most locations in the San Juan Basin.
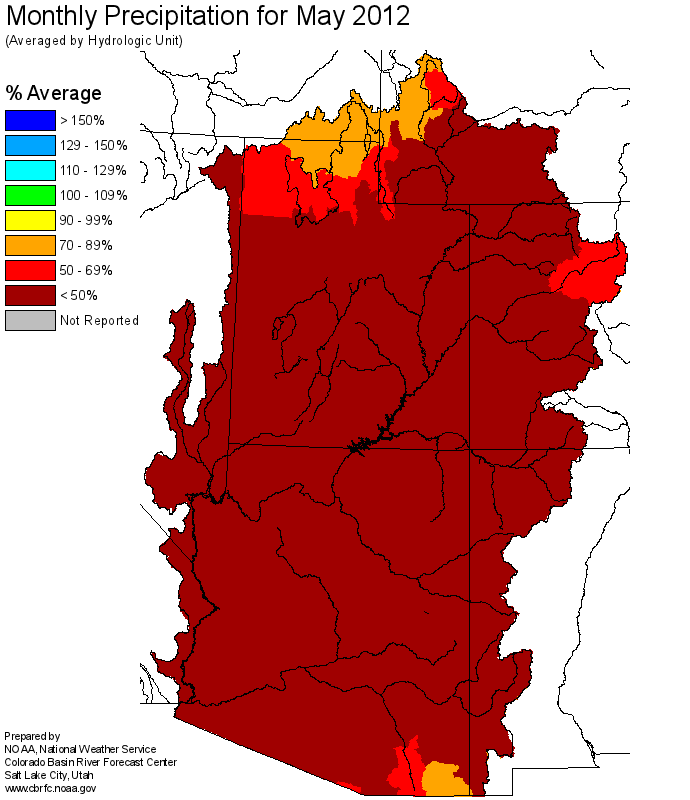
May was the third consecutive month with very dry conditions.
Precipitation in May ranged from 0 to near
55 percent of average over most of the San Juan Basin. The Basin average from the month of May was 25%
of average.
Snow:
Snow melted off at measuring sites by early June. The warm and dry spring caused snow to melt out a full
4 to 6 weeks early at many locations.
Animas River Basin
Snow Plot.
San Juan Basin (above Navajo Reservoir)
Snow Plot.
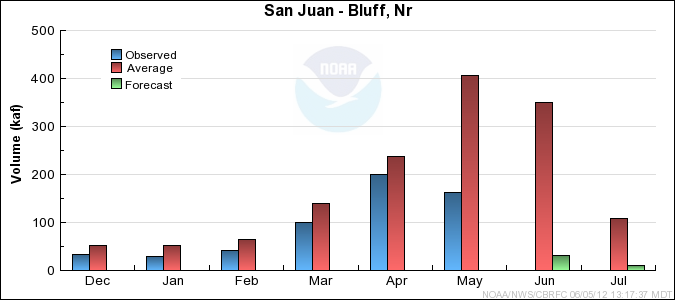
Streamflow:
Streamflow volumes were much below average in May due to the lack of snow. Runoff volumes in May ranged from 40 to 60 percent
of average.
Soil Moisture:
Modeled
soil moisture was near to above
average at highest elevations entering the winter season. Below average soil moisture conditions existed
over the southern half of the basin and in tributaries further downstream.
Climate Forecasts:
La Nina climate conditions existed through the winter months. The La Nina climate condition suggests drier
than average conditions possible over the San Juan Basin. The La Nina climate condition was considered when
developing the forecasts.
Forecast Summary:
The 2012 season was defined by very dry and warm conditions that persisted throughout the spring that
resulted in a very early snow melt. At times during the spring the snow pack was at record or near
record low levels due to the dry and warm conditions. Runoff volume forecasts were reduced as the season
progressed and the dry conditions persisted. Forecasts have been reduced slightly from those issued
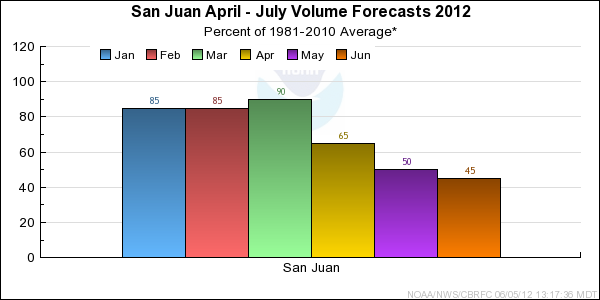
in early May and some are in the bottom 5 of the historical record. April-July
runoff volumes
are expected to range from 35 to 55 percent of the 1981-2010 average. June-July
runoff volumes volumes are expected to range from near 10 to 30 percent of average.
Differences between the full period forecasts and the residual forecasts may not exactly equal the actual observed volumes due to rounding conventions (see Definitions section).