Note: This publication is currently undergoing major revisions. The current publication will be replaced with a new publication based on stakeholder requirements and scientific advances. We expect to begin sharing details on this soon. If you have input on content, format, or publication frequency at any time, please contact us at cbrfc.webmasters@noaa.gov.Great Basin Water Supply Outlook, February 1, 2011Great Basin Water Supply Outlook, February 1, 2011
Contents
Great Basin Summary

*Median of forecasts within each basin.
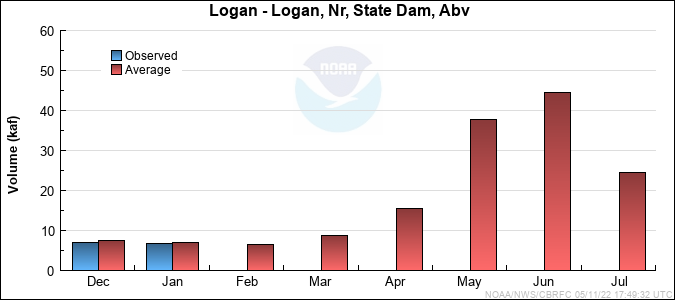
Bear Basin Conditions
The following conditions influenced this month's forecasts:
Precipitation:
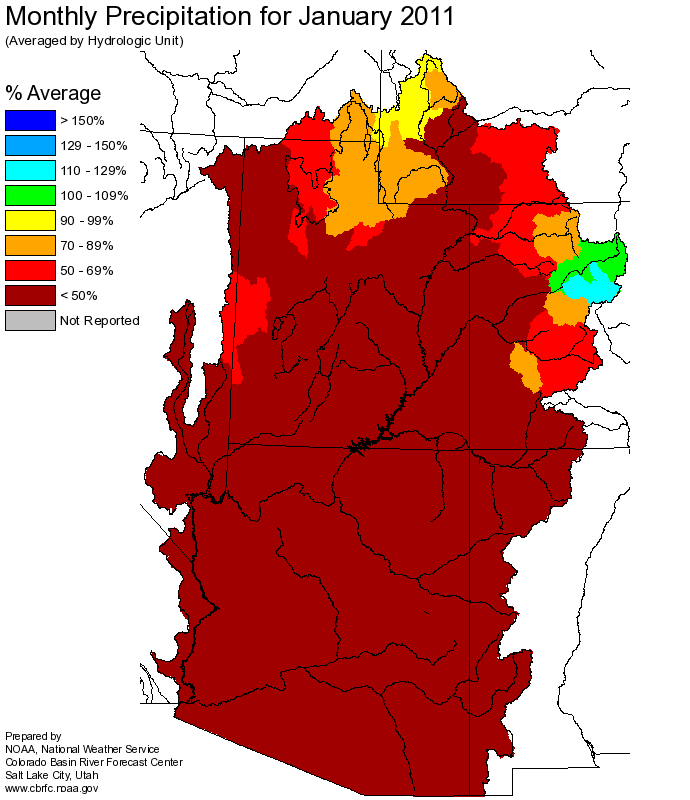
January
precipitation was 89 percent of average.
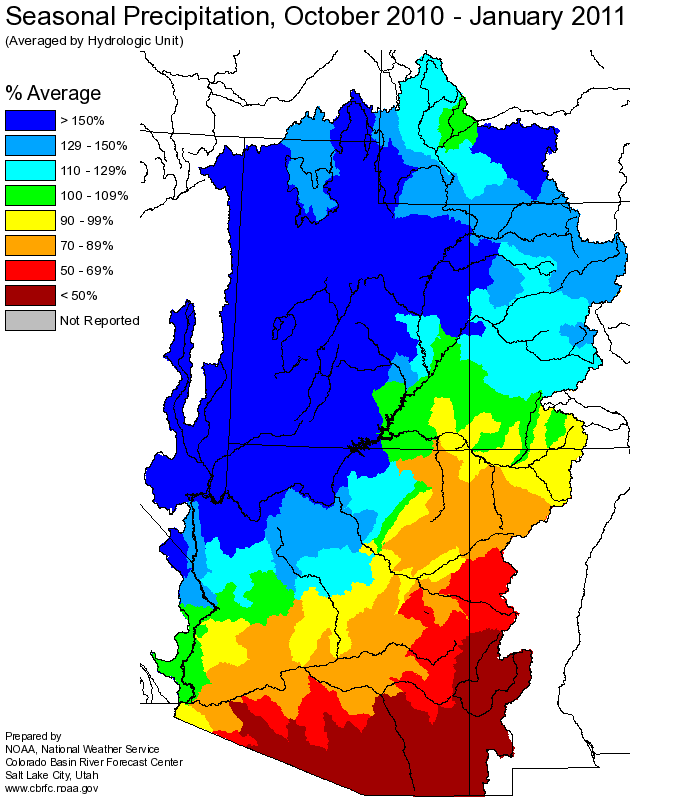
Seasonal, October through January
precipitation was 152 percent of average.
Streamflow:
January streamflows for the Little Bear River above Hyrum Reservoir were 98 percent of average.
Snowpack:
Snowpacks in the Bear Basin are 141 percent of average.
Upper Bear River Basin
Snow Plot.
Bear River Below Woodruff Narrows Reservoir
Snow Plot.
Bear River Basin
Snow Plot.
Soil Moisture:
Modeled Soil
Moisture states were near average to above average for the northern Uinta Mountains heading into the winter.
Climate Forecasts:
Climate forecasts were not factored into the northern Utah forecasts because there is not a strong statistical correlation between
El Nino/La Nina conditions and winter precipitation.
Forecast Summary:
Monthly precipitation dropped off significantly this month but seasonal accumulations remain much above average.
Current
April through July seasonal volume forecasts remain above to much above average
and range between 123 and 141 percent of average with a median value of 130 percent.

* Percent usable capacity, not percent average contents.
Click for multi-month Graph.
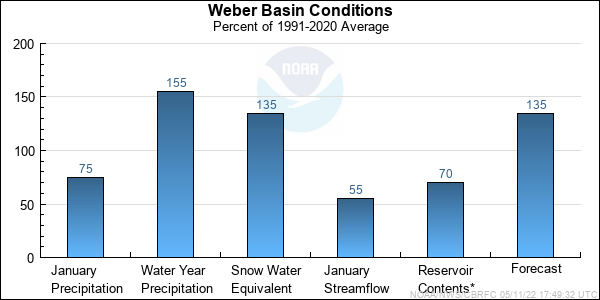
Weber Basin Conditions
The following conditions influenced this month's forecasts:
Precipitation:
January
precipitation was 67 percent of average.
Seasonal October through January
precipitation was 157 percent of
average.
Streamflow:
January streamflow above Rockport Reservoir were 49 percent of average. The Weber at Coalville was 61 percent of average.
Snowpack:
Snowpacks are currently 136 percent of average.
Weber River Basin
Snow Plot.
Upper Weber River Basin
Snow Plot.
Soil Moisture:
Modeled Soil
Moisture states were mostly above normal in the western Uinta Mountains near the headwaters of the Weber heading into winter.
Climate Forecasts:
Climate forecasts were not factored into the northern Utah forecasts because there is not a strong correlation between
El Nino conditions and winter precipitation.
Forecast Summary:
Monthly precipitation dropped off significantly this month but seasonal accumulations remain much above average.
Current
April through July seasonal volume
forecasts remain much above average, and range between 121 and 141 percent of average with a median value of 133 percent.
* Percent usable capacity, not percent average contents.
Click for multi-month Graph.
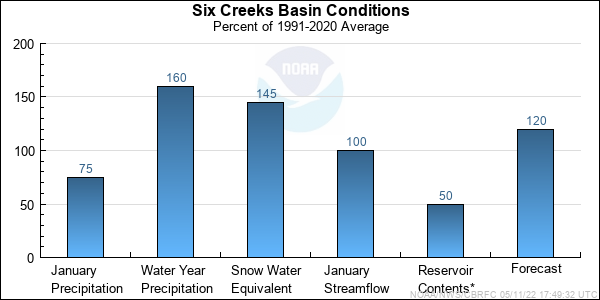
Six Creeks Basin Conditions
The following conditions influenced this month's forecasts:
Precipitation:
January
precipitation was 76 percent of average.
Seasonal October through January
precipitation was 160 percent
of average.
Streamflow:
Streamflows for City Creek near Salt Lake City were 100 percent of average.
Snowpack:
Snowpacks are currently 146 percent of average.
Six Creeks River Basin
Snow Plot.
Big and Little Cottonwood Canyons
Snow Plot.
Soil Moisture:
Modeled Soil
Moisture states were near average in the Six Creeks Basin heading into winter.
Climate Forecasts:
Climate forecasts were not factored into the northern Utah forecasts because there is not a strong correlation between
El Nino conditions and winter precipitation.
Forecast Summary:
Monthly precipitation dropped off significantly this month but seasonal accumulations remain much above average.
Current
April through July seasonal volume forecasts remain above average to much above average,
and range between 116 and 144 percent of average with a median value of 120 percent of average.
* Percent usable capacity, not percent average contents.
Click for multi-month Graph.
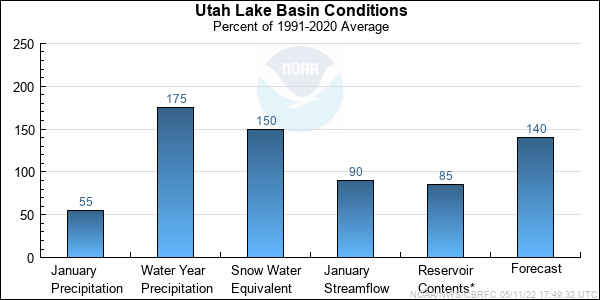
Utah Lake Basin Conditions
The following conditions influenced this month's forecasts:
Precipitation:
January
precipitation was 54 percent of average.
Seasonal October thought January
seasonal precipitation is 174 percent of average, a 40 percent drop from January 1st.
Streamflow:
January's calculated inflow to Utah Lake was 75 percent of average . Spanish Fork nr Castilla was 140 percent of average.
Snowpack:
Snowpack are currently 152 percent of average.
Provo River, Utah Lake Basin
Snow Plot.
Soil Moisture:
Modeled Soil
Moisture states were average to above average heading into the winter.
Climate Forecasts:
Climate forecasts were not factored into the northern Utah forecasts because there is not a strong correlation between
El Nino conditions and winter precipitation here.
Forecast Summary:
Monthly precipitation dropped off significantly this month but seasonal accumulations remain much above average. Current
April through July seasonal volume forecasts remain much above average
and range between 98 and 141 percent of average with a median value of 133 percent.
* Percent usable capacity, not percent average contents.
Click for multi-month Graph.
Differences between the full period forecasts and the residual forecasts may not exactly equal the actual observed volumes due to rounding conventions (see Definitions section).
Monthly Streamflows


Precipitation Maps
Hydrologist: B.Bernard
