Note: This publication is currently undergoing major revisions. The current publication will be replaced with a new publication based on stakeholder requirements and scientific advances. We expect to begin sharing details on this soon. If you have input on content, format, or publication frequency at any time, please contact us at cbrfc.webmasters@noaa.gov.Great Basin Water Supply Outlook, March 1, 2009Great Basin Water Supply Outlook, March 1, 2009
Contents
Great Basin Summary
Snow Water Equivalent & Precipitation -
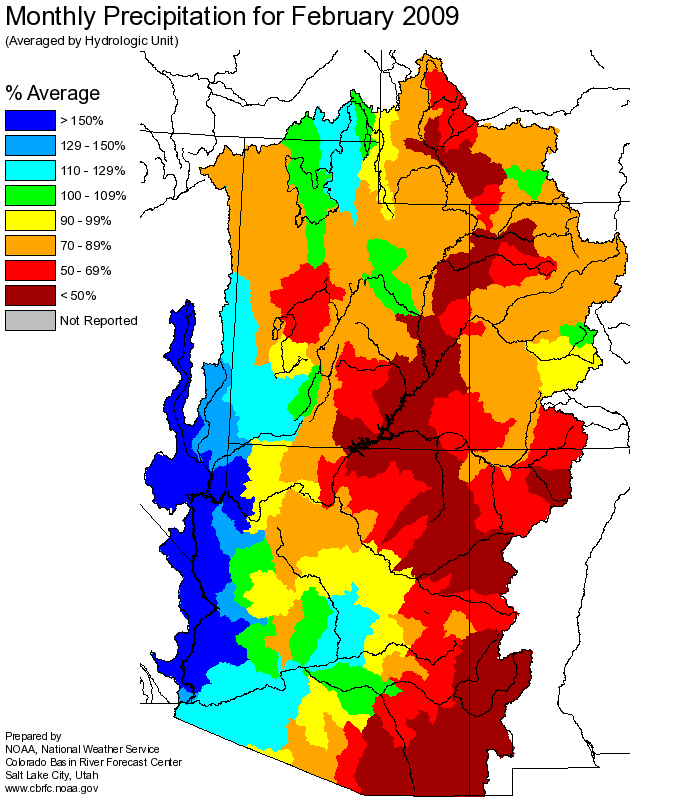
February precipitation in the Great Basin was average at 98%. Snow accumulation was average this past month and
remains slightly below average for the season. Indexed snow totals were 97% of average in the Weber and Ogden basins, 92% in the Provo
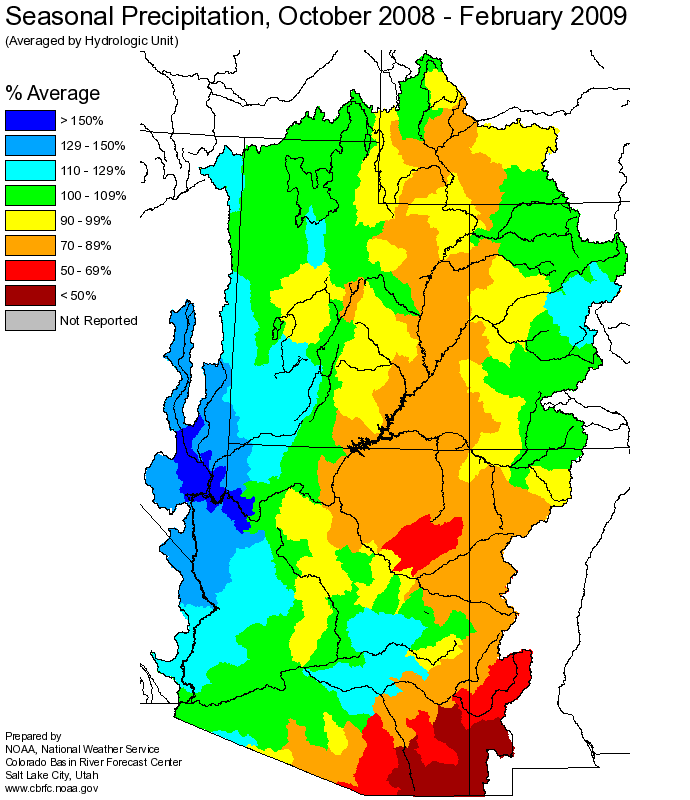
basin, 90% in the Bear River basin and 102% in the Six Creeks basin. Seasonal precipitation for the Great Basin
Salt Lake Basin was 102% of average and overall snow water equivalents are 96% of average.
Soil Moisture & Streamflow -
Soil
moisture grids from the
ESP model
remain below to much below average in all headwater regions, which tends
to lower April through July volume forecasts.
Streamflow for selected points in each of the four main drainages were 98% of average.
Short Term Precipitation Forecasts -
Weather guidance from
National Weather Service Meteorological Models show cool and wet conditions during the first 6-10 days of the month.
Longer range guidance shows a trend toward above average temperatures and below
normal precipitation.
General Discussion -
Longer range predictions from NOAA's Climate Prediction Center are now factoring in a weak
La Nina
episode, predicted to last through the spring of 2009. Please reference the web link above
for further details and effects within the Great Basin.
Volumetric forecasts were largely unchanged in the Bear River Basin with the median forecast being 85% of average.
In the Weber, Provo and Six Creeks drainages, forecasts remained at their February 1st values or were lowered slightly.
This month we begin forecasting the max summer elevation of the Great Basin. Current ESP estimates are for a final maximum elevation of 4194.66 ft. above mean sea level by early to mid May, 2009. The lake is currently
at 4194.01 ft. above mean sea level
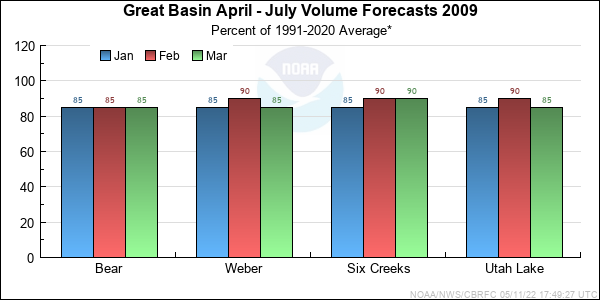
*Median of forecasts within each basin.
Bear Basin Conditions
Snow Water Equivalent & Precipitation -
Snow Water Equivalent and precipitation conditions in the Bear River drainage improved slightly during February. Monthly
precipitation was 109% of average and
snow
water equivalent increased to 92% of average. Seasonal precipitation is currently 101% of average.
Soil Moisture & Streamflow -
Observed streamflows for January
were estimated for Bear at the UT/WY State line at 86% of average. Observed flows on the Logan River nr Logan above
State Dam were 86% of average.
Short Term Precipitation Forecasts -
Short term National Weather Service Models are indicating a period of cool and wet weather during the first 6-10 days of the month.
Short term
CPC guidance shows the possibility of below average precipitation and
above normal temperatures for the middle of March.
General Discussion -
Volumetric forecast for April through July were largely unchanged this month and range from 60% at Bear nr Montpelier
to 87% of average at the Utah, Wyoming State line.
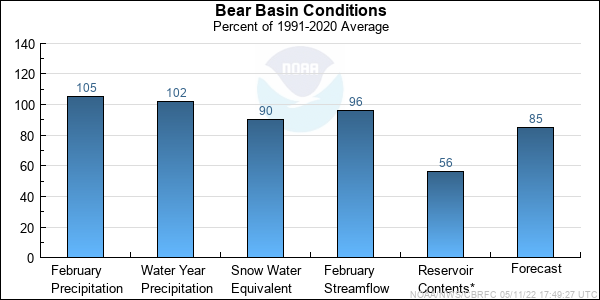
* Percent usable capacity, not percent average contents.
Click for multi-month Graph.
Weber Basin Conditions
Snow Water Equivalent and Precipitation -
Conditions in the Weber and Ogden River River basins remain largely unchanged for February 2009. Monthly
precipiation totalled 94% of average, while
snow
water equivalent numbers remainded steady at 97% of average. The explaination is that high elevation stations were favored during February and received more water than valley locations.
This trend is apparent in the monthly maps at the end of this report. Seasonal precipitation decreased slightly to 97% of average.
Soil Moisture & Streamflow -
Soil moisture conditions remain dry in the upper basin, varying from 70% to 89% of average. Observed streamflows for the month
were 102% of average for the Weber at Oakley.
Short Term Precipitation Forecasts -
Short term weather service models are indicating a period cool and wet weather during the first 6-10 days of the month.
Short term CPC guidance shows the possibility of below average precipitation and
normal temperatures during the middle of March.
General Discussion -
Volumetric forecasts in the Weber Basin were all lowered and weighted more towards ESP models results than SWS equations results, which weight low soil moistures condition, the trend in warmer than average
temperatures for the last 7 years and the slightly below average monthly precipitation numbers for February. The forecasts now range from 78% at Echo Reservoir to 90% of average at Wheeler Creek near Pineview Reservoir.
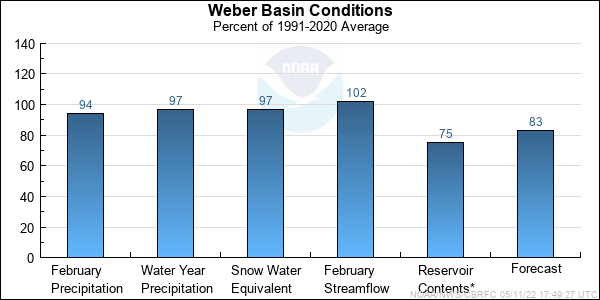
* Percent usable capacity, not percent average contents.
Click for multi-month Graph.
Six Creeks Basin Conditions
Snow Water Equivalent & Precipitation -
Snow Water Equivalent and precipitation conditions in the Six Creeks basins remained largely unchanged during February. Monthly precipitation was 86% of average and
snow water equivalent
was 102% of average. Seasonal precipitation now totals 108% of average.
Soil Moisture & Streamflow -
Streamflows in Big and Little Cottonwood Canyons were 96% of average. Soil moisture grids currently range from
50%-90% of average.
Short Term Precipitation Forecasts -
Short term weather service models are indicating a period of cool and wet weather during the next 6-10 days in the Six Creeks region.
Short term
CPC guidance shows the possibility of below average precipitation for the middle of March.
General Discussion -
Volumetric forecasts remained steady for most points in the Six Creeks basin. Forecast now range from 84% at Parleys Creek near Salt Lake City to 98% at Little
Cottonwood Canyon near Salt Lake City.
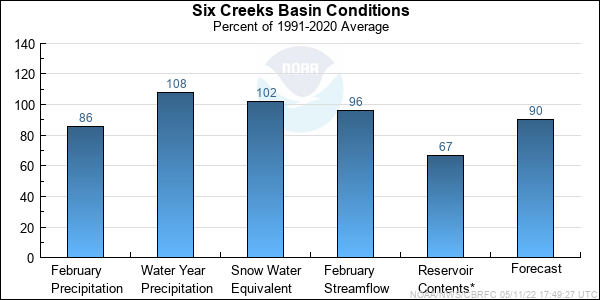
* Percent usable capacity, not percent average contents.
Click for multi-month Graph.
Utah Lake Basin Conditions
Snow Water Equivalent & Precipitation -
Snow Water Equivalent and precipitation conditions in the Utah Lake drainages showed below average accumulations for the month of February . Monthly precipitation
totalled 82% and
snow
water equivalent numbers are 92% of average. Seasonal precipitation now totals 103% of
average. There were problems with the Timanogos Divide SNOTEL and calculations with out it show 85% SWE but we
have include ground truth measurements and NRCS indicate 92% of average snow water equivalent.
Soil Moisture & Streamflow -
Streamflows for Spanish Fork near Castilla and Provo at Woodland combined were 100% of average. Soil moisture grids along the Provo River range from 50-90% of
average. The Spanish Fork drainage ranges from 70% to 99% of average.
Short Term Precipitation Forecasts -
Short term weather service models are indicating a period of cool and wet weather during the first 6-10 days of the month.
Short term
CPC guidance shows the possibility
of below average precipitation and above average temperatures during the middle of March.
General Discussion -
Volumetric forecast for Utah Lake and its associated rivers were lowered this month in responsed to below average precipiation and continued dry soil moisture conditions from last summer and fall.
The forecast now range from 85% at Utah Lake to 94% at American Fork near the UP Power Plant.

* Percent usable capacity, not percent average contents.
Click for multi-month Graph.
Differences between the full period forecasts and the residual forecasts may not exactly equal the actual observed volumes due to rounding conventions (see Definitions section).
Precipitation Maps
Hydrologist: B.Bernard
