NOAA, National Weather Service
Colorado Basin River Forecast Center
Salt Lake City, Utah
www.cbrfc.noaa.gov
| Prepared by B.Bernard NOAA, National Weather Service Colorado Basin River Forecast Center Salt Lake City, Utah www.cbrfc.noaa.gov |

| Forecast Period | 90% Exceedance Volume | 50% Exceedance Volume | Percent Average | 10% Exceedance Volume | |
| Bear | |||||
| Utah | April-July | 129 | 160 | 142 | 189 |
| Woodruff Narrows Res * | April-July | 136 | 185 | 136 | 245 |
| Montpelier, Nr, Stewart Dam, Blo * | April-July | 255 | 355 | 151 | 515 |
| Big Ck | |||||
| Randolph, Nr | April-July | 5.6 | 8 | 167 | 9.6 |
| Smiths Fork | |||||
| Border, Nr | April-July | 106 | 130 | 126 | 157 |
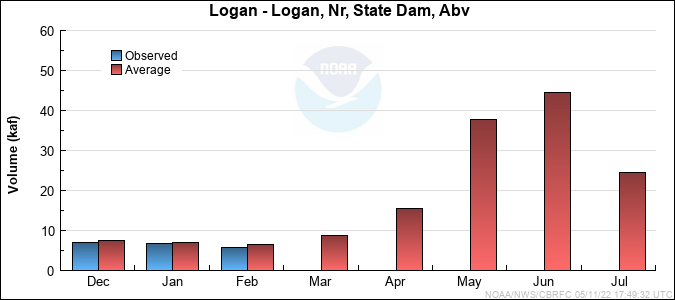
| Logan | |||||
| Logan, Nr, State Dam, Abv | April-July | 146 | 168 | 133 | 199 |
| Blacksmith Fork | |||||
| Hyrum, Nr, Upnl Dam, Abv | April-July | 62 | 80 | 167 | 98 |
| Little Bear | |||||
| Paradise | April-July | 49 | 68 | 148 | 88 |
| Forecast Period | 90% Exceedance Volume | 50% Exceedance Volume | Percent Average | 10% Exceedance Volume | |
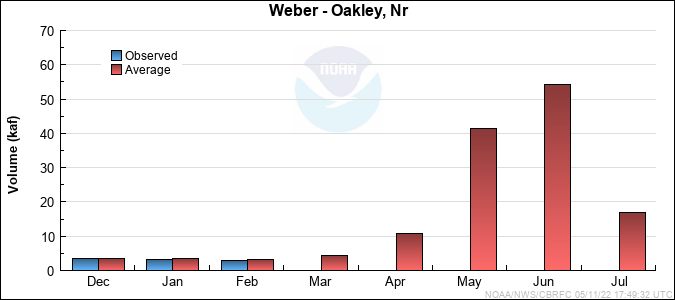
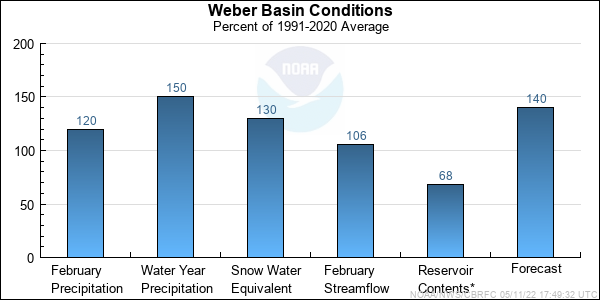
| Weber | |||||
| Oakley, Nr | April-July | 141 | 170 | 138 | 210 |
| Rockport Res, Wanship, Nr | April-July | 151 | 188 | 136 | 240 |
| Coalville, Nr | April-July | 164 | 205 | 149 | 265 |
| Chalk Ck | |||||
| Coalville | April-July | 52 | 68 | 151 | 95 |
| Weber | |||||
| Echo Res, Echo, At | April-July | 215 | 270 | 150 | 360 |
| Lost Ck | |||||
| Lost Ck Res, Croydon, Nr | April-July | 15 | 23 | 131 | 31 |
| East Canyon Ck | |||||
| Jeremy Ranch, Nr | April-July | 17 | 22 | 155 | 28 |
| East Canyon Res, Morgan, Nr | April-July | 33 | 45 | 145 | 58 |
| Weber | |||||
| Gateway | April-July | 420 | 550 | 155 | 735 |
| Sf Ogden | |||||
| Huntsville, Nr | April-July | 65 | 88 | 138 | 108 |
| Ogden | |||||
| Pineview Res, Ogden, Nr | April-July | 130 | 180 | 135 | 210 |
| Wheeler Ck | |||||
| Huntsville, Nr | April-July | 6 | 8.8 | 140 | 12 |
| Centerville Ck | |||||
| Centerville,nr, Div,abv | April-July | 1 | 1.7 | 96 | 2.4 |
| Forecast Period | 90% Exceedance Volume | 50% Exceedance Volume | Percent Average | 10% Exceedance Volume | |
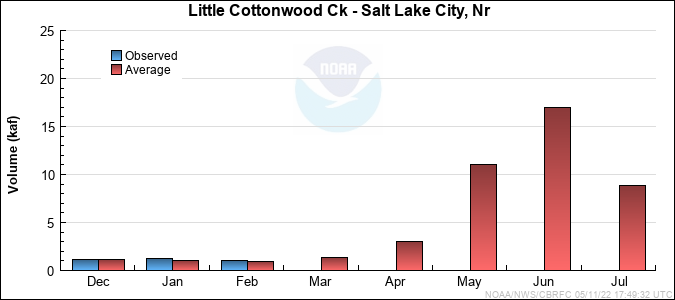
| Little Cottonwood Ck | |||||
| Salt Lake City, Nr | April-July | 40 | 49 | 123 | 58 |
| Big Cottonwood Ck | |||||
| Salt Lake City, Nr | April-July | 36 | 46 | 121 | 56 |
| Mill Ck | |||||
| Salt Lake City, Nr | April-July | 6.5 | 8.5 | 121 | 10.9 |
| Dell Fk | |||||
| Little Dell Res | April-July | 6.3 | 8.2 | 121 | 11.2 |
| Parleys Ck | |||||
| Salt Lake City, Nr | April-July | 15.2 | 21 | 126 | 30 |
| Emigration Ck | |||||
| Salt Lake City, Nr | April-July | 4 | 6 | 133 | 8 |
| City Ck | |||||
| Salt Lake City, Nr | April-July | 11 | 13 | 149 | 15 |
| Vernon Ck | |||||
| Vernon, Nr | April-June | 0.9 | 2.1 | 142 | 3.3 |
| S Willow Ck | |||||
| Grantsville, Nr | April-July | 3.5 | 4.6 | 144 | 6.4 |
| Dunn Ck | |||||
| Park Valley, Nr | April-July | 2.6 | 5 | 161 | 7.6 |
| Forecast Period | 90% Exceedance Volume | 50% Exceedance Volume | Percent Average | 10% Exceedance Volume | |
| Spanish Fork | |||||
| Castilla, Nr | April-July | 88 | 120 | 156 | 160 |
| Provo | |||||
| Woodland, Nr | April-July | 120 | 145 | 141 | 171 |
| Hailstone, Nr | April-July | 128 | 155 | 142 | 188 |
| Deer Ck Res | April-July | 153 | 190 | 151 | 235 |
| American Fork | |||||
| American Fork, Nr, Up Pwrplnt, Abv | April-July | 40 | 48 | 150 | 62 |
| West Canyon Ck | |||||
| Cedar Fort, Nr | April-July | 2 | 3.2 | 139 | 4.5 |
| Salt Ck | |||||
| Nephi | April-July | 6 | 15 | 114 | 21 |
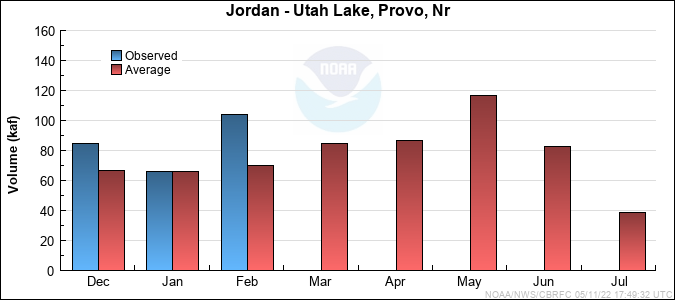
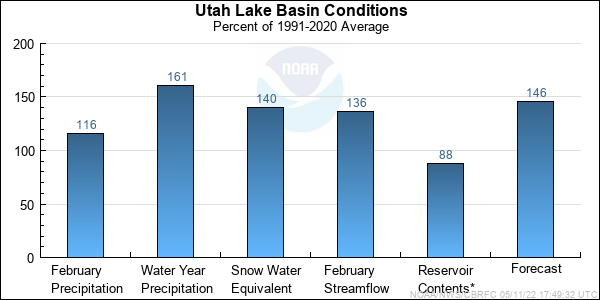
| Jordan | |||||
| Utah Lake, Provo, Nr | April-July | 425 | 540 | 164 | 700 |
| Range | Round to | |
| 0-1.99 | 0.01 | |
| 2.0-19.9 | 0.1 | |
| 20-199 | 1.0 | |
| 200-999 | 5.0 | |
| 1000+ | 3 significant digits |