New 1981-2010 Averages being used this year.
Note: This publication is currently undergoing major revisions. The current publication will be replaced with a new publication based on stakeholder requirements and scientific advances. We expect to begin sharing details on this soon. If you have input on content, format, or publication frequency at any time, please contact us at cbrfc.webmasters@noaa.gov.Great Basin Water Supply Outlook, March 1, 2012Great Basin Water Supply Outlook, March 1, 2012
Contents
Great Basin Summary
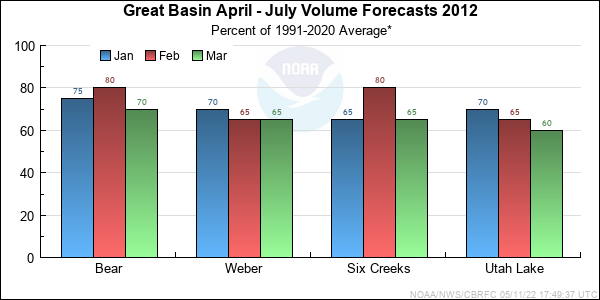
*Median of forecasts within each basin.
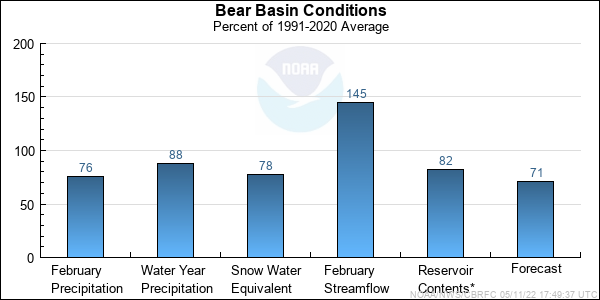
Bear Basin Conditions
The following conditions influenced this month's forecasts:
Precipitation:
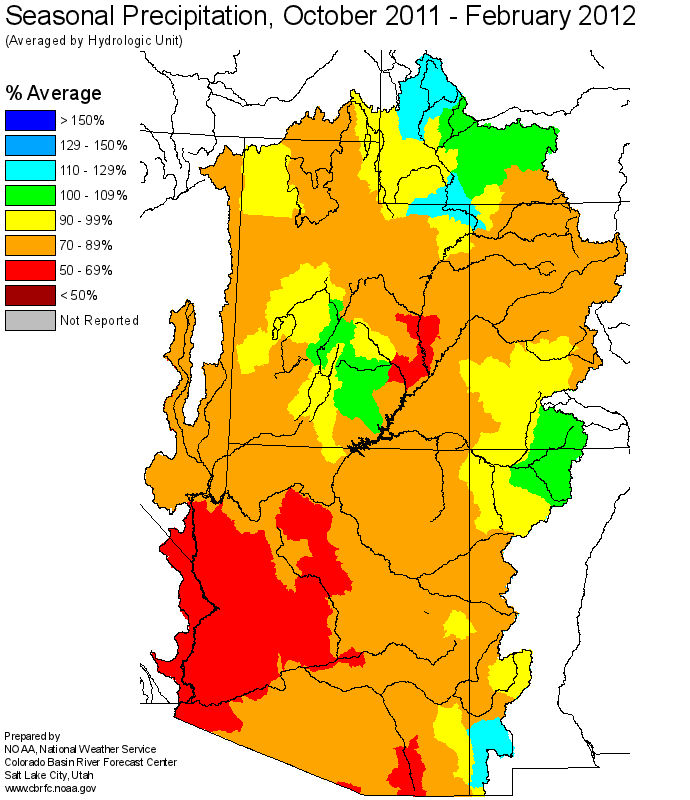
Seasonal October through February
precipitation was 84 percent of average
in the upper Bear Basin.
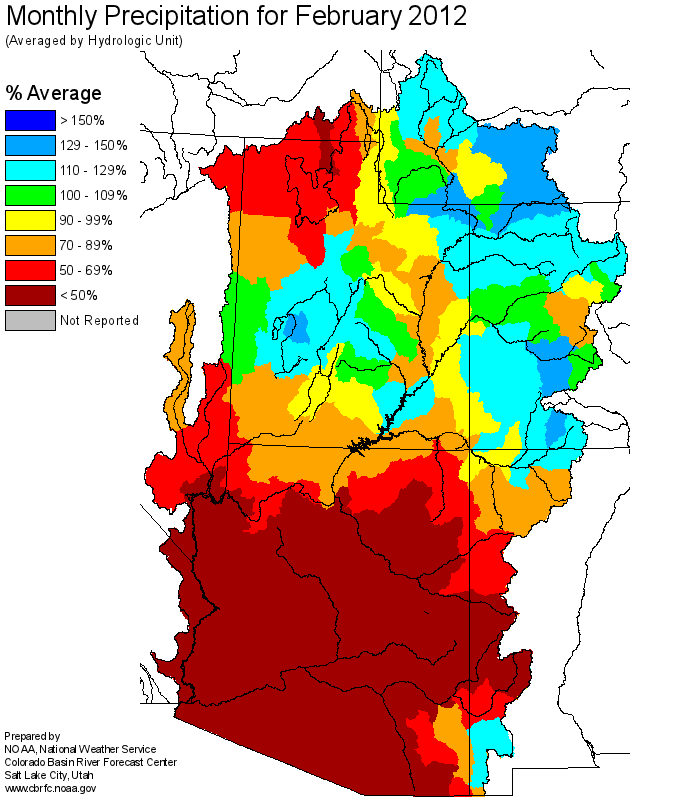
February
precipitation was 83 percent of average.
Streamflow:
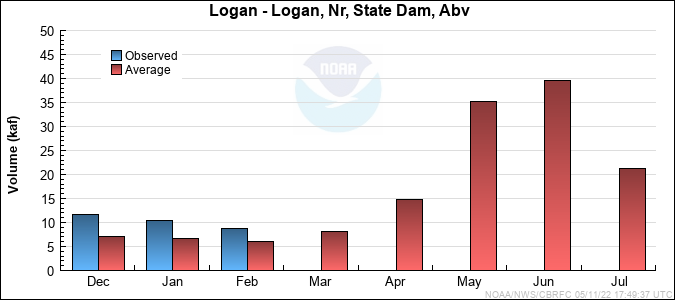
The Bear River at Stewart Dam was 142 percent of average. The Logan River above State Dam recorded 145 percent of average streamflow.
Snowpack:
This years snow remains below average. The current snow water equivalent for the Bear Basin is 78 percent of average. As of water year 2012 the CBRFC has re-calculated all snow stations to reflect the new 30 year average from 1981-2010.
Upper Bear River Basin
Snow Plot.
Bear River Below Woodruff Narrows Reservoir
Snow Plot.
Bear River Basin
Snow Plot.
Soil Moisture:
Modeled Soil
Moisture, click on map to zoom. Modeled soil moisture states indicate above average moisture conditions as of February 1st. This is a contributor to
the above average baseflows in the Bear River Basin.
Climate Forecasts:
Climate forecasts were not a factored into the northern Utah forecasts because there is not a strong correlation between
La Nina conditions and winter precipitation.
Forecast Summary:
The current Bear River volume forecast range from much below average to below average.
April through July seasonal volume forecast range
from 64 to 84 percent of average with a median volume of 71 percent of average. The above average soil moisture and slightly higher than average baseflow conditions are
resulting in higher forecast than one might expect due to snow conditions only.
* Percent usable capacity, not percent average contents.
Click for multi-month Graph.
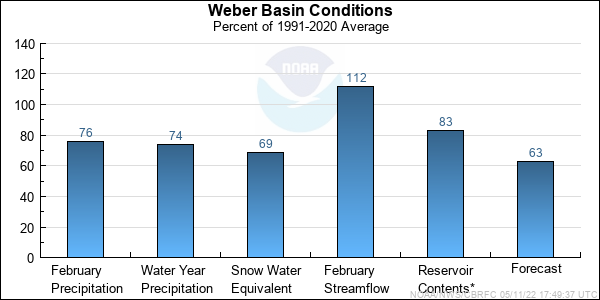
Weber Basin Conditions
The following conditions influenced this month's forecasts:
Precipitation:
Seasonal October through February
precipitation is 76 percent of
average.
February
precipitation was 74 percent of average.
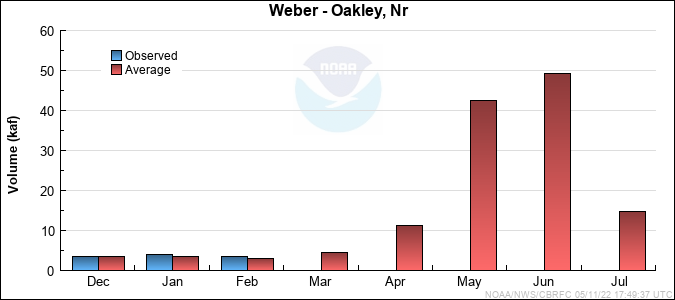
Streamflow:
The Weber at Oakley gage was estimated to be 112 percent of average. The inflow to Rockport Reservoir was 100 percent of average.
Snowpack:
This years snow remains below average. The current snow water equivalent index is 69 percent of average..
As of water year 2012 the CBRFC has re-calculated all snow stations to reflect the new 30 year average from 1981-2010.
Weber River Basin
Snow Plot.
Upper Weber River Basin
Snow Plot.
Soil Moisture:
Modeled Soil
Moisture, click on map to zoom. Modeled soil moisture states indicate above average moisture conditions as of February 1st. This is a contributor to
the above average baseflows in the Weber River Basin.
Climate Forecasts:
Climate forecasts were not a factored into the northern Utah forecasts because there is not a strong correlation between
La Nina conditions and winter precipitation.
Forecast Summary:
The April though July volume forecast for the Weber Basin are currently much below to below average.
April through July seasonal volume forecasts range
between 59 and 70 percent of average with a median forecast volume of 63 percent of average. Overall this represents a decrease in the median from last month.
The above average soil moisture and slightly higher than average baseflow conditions are resulting in higher forecast than one might expect due to snow conditions only.
* Percent usable capacity, not percent average contents.
Click for multi-month Graph.
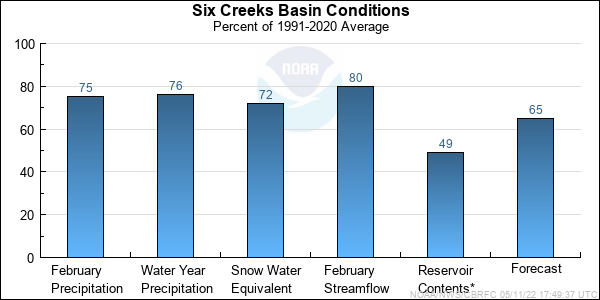
Six Creeks Basin Conditions
The following conditions influenced this month's forecasts:
Precipitation:
Seasonal October through February
precipitation was near 75 percent of average.
February
precipitation was 76 percent of average.
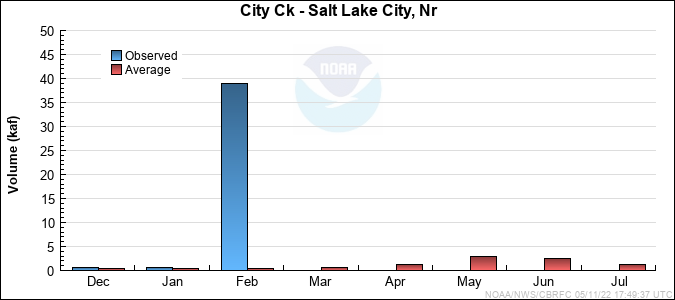
Streamflow:
February streamflow for City Creek near Salt Lake City was 85 percent of average. Big Cottonwood Creek nr Salt Lake City was 74 percent of average.
Snowpack:
This year's snow remains below average. The current indexed snow water equivalent is 72 percent of average. As of water year 2012 the CBRFC has re-calculated all
snow stations to reflect the new 30 year average from 1981-2010.
Six Creeks Headwaters Basins
Snow Plot.
Big and Little Cottonwood Canyons
Snow Plot.
Soil Moisture:
Modeled Soil
Moisture, click on map to zoom. Modeled soil moisture states indicate mostly above average mositure conditions as of February 1st. Although flows are dropping in the Six Creeks basin, above
average soil moistures have been influencing baseflows through the fall and February was the first month that they dropped to near average.
Climate Forecasts:
Climate forecasts were not factored into the northern Utah forecasts because there is not a strong correlation between
La Nina conditions and winter precipitation.
Forecast Summary:
The current Six Creeks streamflow volume forecasts remain much below to below average.
April through July seasonal volume forecasts range between 62 to 79 percent of average
with a median forecast of 66 percent of average. The above average soil moisture and higher than average current baseflow conditions are resulting in slightly
higher forecast than one might expect due to current snow conditions only.
* Percent usable capacity, not percent average contents.
Click for multi-month Graph.
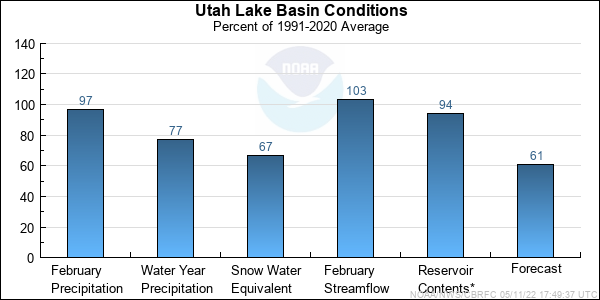
Utah Lake Basin Conditions
The following conditions influenced this month's forecasts:
Precipitation:
Seasonal October thought February
seasonal precipitation was 77 percent of average.
February
precipitation was 97 percent of average.
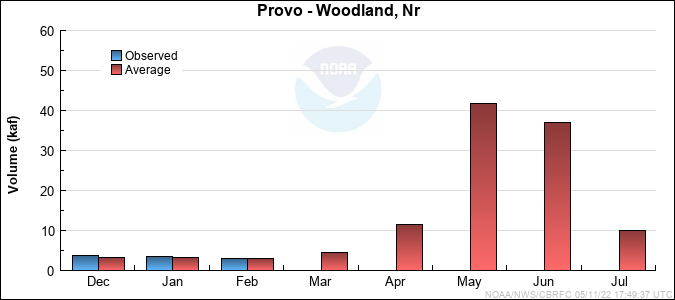
Streamflow:
Streamflows for the Provo at Woodland were 103 percent of average 106 percent of median, holding steady from last month. Unregulated inflow to Utah Lake was recorded at 87 percent of average which
represents a significant drop from the previous month presumably from the lack of snow and precipitation at lower elevations.
Snowpack:
This year's snow as of February 1 remains below average. Current snow water equivalent are 67 percent of average.. As of water year 2012 the CBRFC has re-calculated all snow stations to reflect the new
30 year average from 1981-2010.
Provo River, Utah Lake Drainage
Snow Plot.
Soil Moisture:
Modeled Soil
Moisture, click on map to zoom. Modeled soil moisture states indicate mostly average to above average conditions as of February 1st. This is a contributor to
the current baseflows conditions in the Provo and Utah Lake forecast.
Climate Forecasts:
Climate forecasts were not factored into the northern Utah forecasts because there is not a strong correlation between
La Nina conditions and winter precipitation here.
Forecast Summary:
The current February forecast for Utah Lake's April through July volumetric forecast dropped slightly as did precipitation and snow as a percent of average.
April through July seasonal volume forecasts range between
57 and 66 percent of average with a median forecast volume of 61 percent of average. The above average soil moisture and higher than average current baseflow conditions are resulting in
higher forecast than one might expect due to current snow conditions only.
* Percent usable capacity, not percent average contents.
Click for multi-month Graph.
Differences between the full period forecasts and the residual forecasts may not exactly equal the actual observed volumes due to rounding conventions (see Definitions section).
Monthly Streamflows

Precipitation Maps
Hydrologist: B.Bernard
